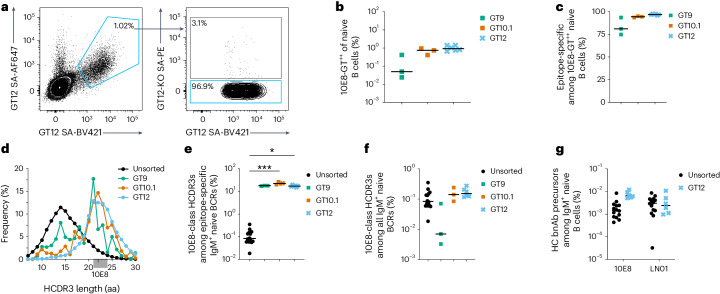
Fig. 4. 10E8-GT scaffolds engage 10E8-class HCDR3s in human blood.
a, Representative flow cytometry staining of 10E8-GT12 double-positive (10E8-GT12++; signifying binding to two probes with different fluorochromes; left) and epitope-specific 10E8-GT12++10E8-GT12-KO– (right) CD20+CD27–IgD+IgG– naive B cells from HIV-seronegative donors; SA, streptavidin. b, Frequency of 10E8-GT9++ (n = 3 donors), 10E8-GT10.1++ (n = 3) and 10E8-GT12++ (n = 6) cells among CD20+IgG– naive B cells for 10E8-GT9 and 10E8-GT10 or CD20+CD27–IgD+IgG– naive B cells for 10E8-GT12 that were sorted from HIV-seronegative donors and BCR sequenced using either a Sanger sequencing method (squares) or a 10x Genomics sequencing method (crosses). c, Percentage of 10E8-GT9++, 10E8-GT10.1++ and 10E8-GT12++ naive B cells (CD20+IgG− B cells or CD20+CD27−IgD+IgG− B cells, as in b) that are epitope specific (10E8-GT9++10E8-GT9-KO−, 10E8-GT10.1++10E8-GT10.1-KO− or 10E8-GT12++10E8-GT12-KO−). d, HCDR3 length distribution for human naive BCRs sorted by 10E8-GT9, 10E8-GT10.1 and 10E8-GT12 (average of all donors in each case). NGS datasets (n = 14) of heavy chains from HIV-seronegative humans served as unsorted controls7,27 where indicated (black). The targeted HCDR3 length range (21–24 aa) is highlighted in gray. The exact HCDR3 length for the 10E8 bnAb is indicated by a tick mark at 22 aa. e, Percentage of 10E8-class HCDR3s (with lengths of 21–24 aa and YxFW at the correct position within HCDR3) among epitope-specific (10E8-GT9++10E8-GT9-KO−, n = 3 donors; 10E8-GT10.1++10E8-GT10.1-KO−, n = 4 donors; 10E8-GT12++10E8-GT12-KO− n = 6 donors) IgM+ BCRs compared to unsorted controls defined in d; *P = 0.03 and ***P = 0.0004. Data were analyzed by Kruskal–Wallis test with a Dunn’s multiple comparison correction. f, Percentage of 10E8-class HCDR3s among all naive IgM+ B cells compared to unsorted controls as in e. g, Percentage of 10E8-class and LN01-class IgH precursors among naive IgM+ B cells sorted with 10E8-GT12 or unsorted controls defined in d. Lines indicate median values.

