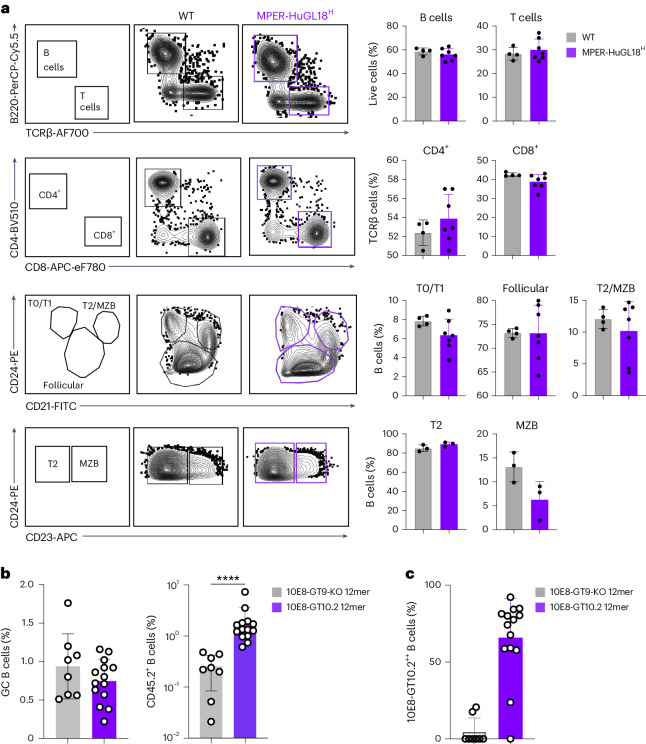
Fig. 5. 10E8-class B cells function in vivo.
a, Flow cytometry analysis and quantification of B220+TCRβ– B cells, B220–TCRβ+ total T cells, CD4+CD8− T cells, CD4−CD8+ T cells, CD2−CD24hi T0/T1 B cells, CD21loCD24lo follicular B cells, CD21hiCD24hiCD23− T2 B cells and CD21hiCD24hiCD23+ marginal zone B (MZB) cells in the spleens of MPER-HuGL18H mice (n = 7) compared to wild-type (WT) C57BL/6 mice (n = 4). Symbols represent individual animals, and error bars indicate standard deviation. b, Frequency of CD38loCD95+ GC B cells among total B220+ B cells (left) and CD45.2+ B cells among CD38loCD95+ GC B cells (right) at day 21 after immunization with 10E8-GT10.2 12mer (n = 14) or control 10E8-GT9-KO 12mer (n = 8) in CD45.1 wild-type recipient mice adoptively transferred with 200,000 CD45.2 MPER-HuGL18H B cells. Symbols represent individual animals; bars indicate mean ± s.d.; ****P < 0.0001. Data were analyzed by two-sided Mann–Whitney test. c, Frequencies of 10E8-GT10++ cells among CD38loCD95+CD45.1−CD45.2+ MPER-HuGL18H GC cells as in b.

