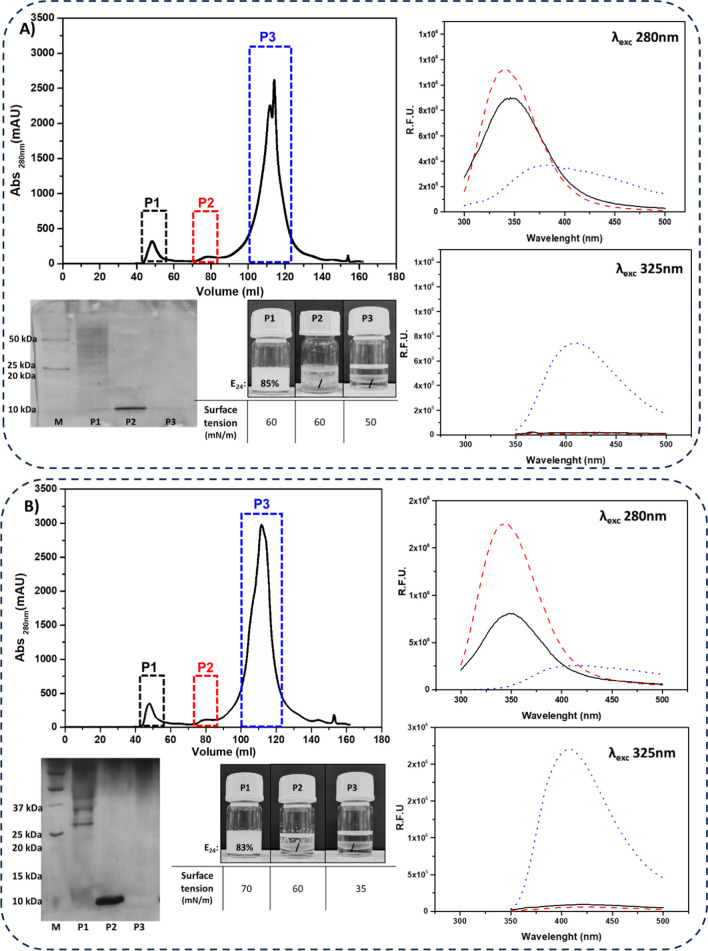
Fig. 6.
Purification and characterization of the raw extracts of MUT4426 (A) and MUT6181 (B). Top left: Chromatographs of gel filtration columns, with collected peaks highlighted in black, red, and blue named P1, P2, and P3 respectively. Fluorescence emission spectra of each peak, at 280 nm λexc (top right), and 325 nm λexc (bottom right); P1 black solid line, P2 red dashed line, P3 blue dotted line. R.F.U. is the reference fluorescence unit. SDS-PAGE, emulsification tests, surface tension values of each peak (bottom left)

