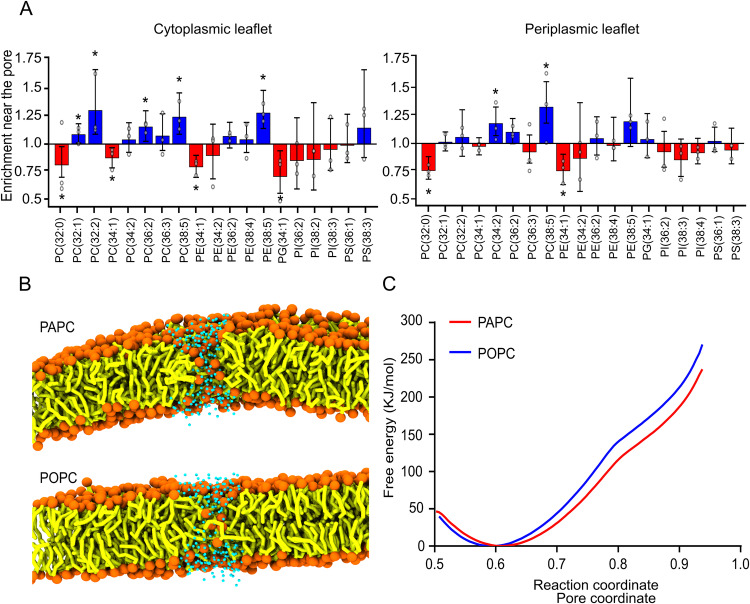
Fig. 4. Molecular dynamics simulations of lipid distribution around a toroidal pore.
A Lipid enrichment analysis near the pore. Coarse-grain Martini 3 models on a lipid membrane mimicking the MOM configured based on apoptotic lipidomic data, with pore formation induced by position restraints. Fold change of indicated lipid species around the toroidal pore. 3 points represent the average of each replicates (from the means of triplicate runs analyzed as uncorrelated sub-trajectory segments — a minimum 43 segments per replicate for the individual lipid analysis and 62 for the per-headgroup one; error bars indicate the boundaries of a 99% confidence interval; *: p values < 0.01 by two-tailed, one-sample, Student’s t-test; confidence intervals and p-values Bonferroni-corrected for multiple comparisons). B Snapshots from an MD simulation after the pore/defect was formed (pore coordinate ~0.88) in PAPC or POPC. Phosphate (orange), tails/glycerols (yellow), water beads in the pore vicinity (cyan); the remainder of the solvent and ions are omitted for a clear view, as are choline beads. C Potential of mean force (PMF) profile as a function of pore coordinate, for pores formed in PAPC and POPC bilayers and simulated with Martini 3. The error estimated from the weighted histogram analysis (WHAM) is of magnitude between 10−1–100 kJ/mol and thus not visible in the 102 kJ/mol scale of the PMF profiles.

