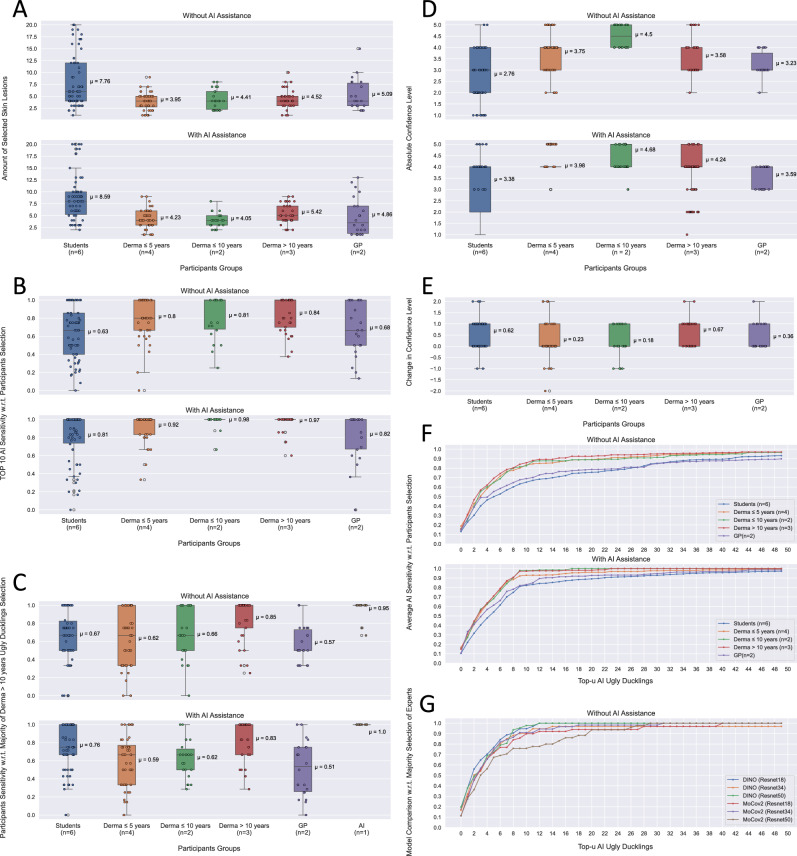
Figure 3.
(A) Comparison of the number of UDs selected per patient image and group participant, with and without AI assistance. (B) Comparison of the top-10 AI sensitivity for each patient image with and without AI assistance, with respect to each participant. (C) Average sensitivity values of each group with respect to majority selection of experts, with and without AI assistance. Additionally, top-10 AI sensitivity values averaged over each patient image are also presented. (D) Comparison of the absolute and (E) the relative changes in confidence for participants, with and without AI assistance, across patient images. (F) Average top-u AI sensitivity values for each group, with and without AI assistance. (G) Comparison the average top-u AI sensitivity values for MoCo v2 and DINO models, with respect to majority selection of experts, for each group without AI assistance.

