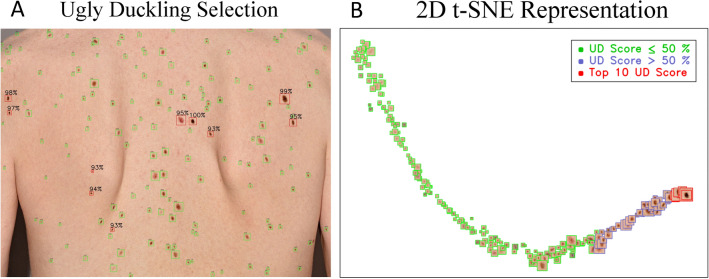
Figure 4.
(A) Illustration of the AI’s identification of the top-10 lesions with highest UD scores (red bounding boxes). Above each lesion are the corresponding UD scores is displayed, providing a quantified assessment of the AI’s confidence in each finding. (B) Showing 2D t-SNE visualization of our embeddings in the latent space. With green bounding boxes we see the lesions rating equal or less than 50% in overall UD score, in blue above 50% and in red the top-10.

