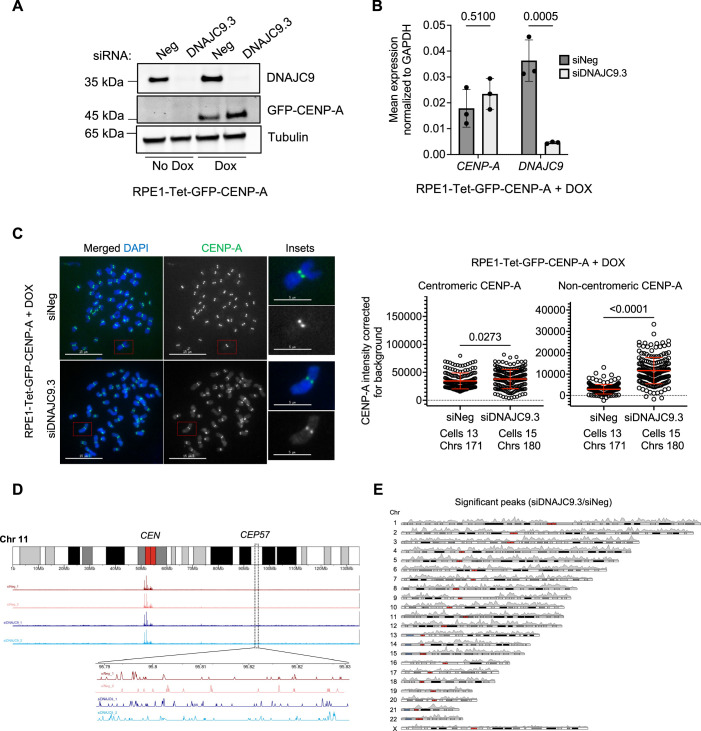
Figure EV5. DNAJC9 depletion promotes CENP-A mislocalization in RPE1-Tet-GFP-CENP-A cells without affecting CENP-A RNA levels.
(A) Western blot of whole-cell extracts showing DNAJC9 depletion in siNeg or siDNAJC9.3-transfected RPE1-Tet-GFP-CENP-A cells with or without 1 µg/ml DOX induction for 48 h post-siRNA transfection. Alpha-tubulin was used as the loading control. (B) Transcript levels of CENP-A are not altered in DNAJC9-depleted RPE1-Tet-GFP-CENP-A cells treated with 1 µg/ml DOX for 48 h. Bar graphs showing mean RNA levels of CENP-A and DNAJC9 normalized to GAPDH in control and DNAJC9-depleted cells using RT-qPCR. Mean values with standard deviation from three biological replicates were plotted and p values were calculated from two-way ANOVA with Sidak’s multiple correction test. (C). CENP-A is mislocalized in DOX-treated RPE1-Tet-GFP-CENP-A cells with DNAJC9 depletion. (Left panel) Representative images of metaphase chromosome spreads immunostained for CENP-A in siNeg or siDNAJC9.3-transfected RPE1-Tet-GFP-CENP-A cells treated with 1 µg/ml DOX for 48 h post-siRNA transfection. Scale bar: 15 µm. Scale bar for insets: 5 µm. (Right) Scatter plots showing CENP-A intensities corrected for background at the centromeric or noncentromeric regions as described above, from three biological replicates. Each circle represents the value from an individual chromosome. Chrs refers to the total number of chromosomes measured per condition from three biological replicates. Mean with standard deviation is shown across all measurements from three biological replicates. P values were calculated using Mann–Whitney U test. (D) Example of binding profile of CENP-A on chromosome 11 in the CENP-A CUT&RUN sequencing datasets with siRNA treatments indicated. Peaks spanning the centromeric region (CEN) and an adjacent representative noncentromeric region (CEP57) are highlighted. Magnified view of noncentromeric localization of CENP-A at CEP57 is also shown. (E) Karyoplot showing the distribution of the 17,341 significantly enriched (adjusted P value less than or equal to 0.05) CENP-A CUT&RUN peaks identified in DNAJC9-depleted GFP-CENP-A expressing RPE1 cells compared to siNeg-treated control. Plot represents the average from two biological replicates.

