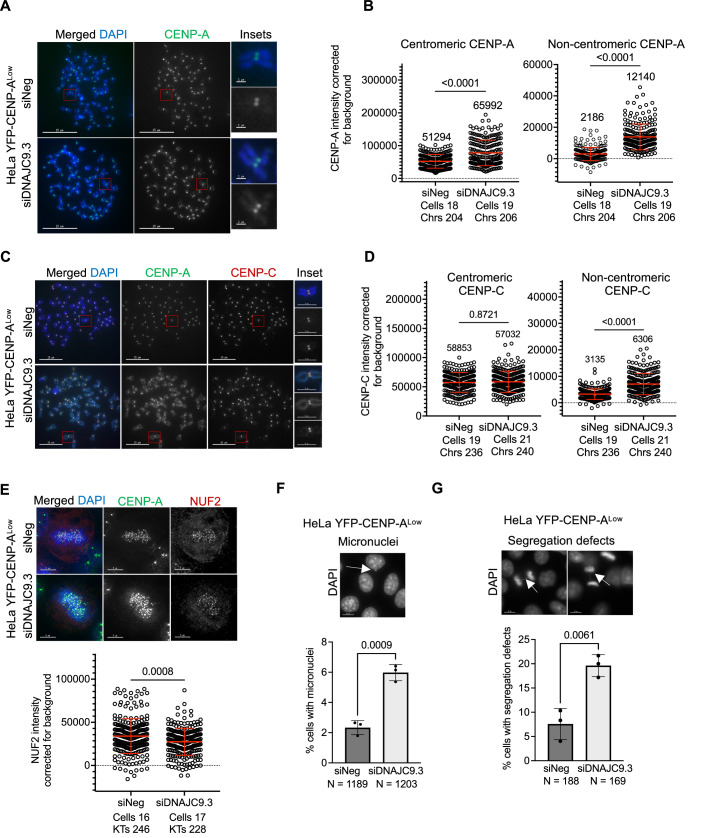
Figure 3. DNAJC9 depletion contributes to mislocalization of CENP-A and CIN in HeLa YFP-CENP-ALow cells.
(A) CENP-A is mislocalized in DNAJC9-depleted HeLa YFP-CENP-ALow cells. Representative images of metaphase chromosome spreads immunostained for CENP-A in siNeg or siDNAJC9.3-transfected HeLa YFP-CENP-ALow cells. Scale bar: 15 µm. Scale bar for insets: 1 µm. (B) Scatter plots showing CENP-A intensities corrected for background at the centromeric or noncentromeric regions as described in (A), from three biological replicates. Median values are shown above graph. Each circle represents the value from an individual chromosome. Chrs refers to the total number of chromosomes measured per condition from three biological replicates. The mean with standard deviation is shown across all measurements from three biological replicates. P values were calculated using Mann–Whitney U test. (C) CENP-C is mislocalized in DNAJC9-depleted HeLa YFP-CENP-ALow cells. Representative images of metaphase chromosome spread immunostained for CENP-C and CENP-A in siNeg or siDNAJC9.3-transfected cells. Scale bar: 15 µm. Scale bar for insets: 1 µm. (D) Scatter plots showing CENP-C intensities corrected for background at the centromeric or noncentromeric regions as described in (C), from three biological replicates. Median values are shown above graph. Each circle represents the value from an individual chromosome. Chrs refers to the total number of chromosomes measured per condition from three biological replicates. Mean with standard deviation is shown across all measurements from three biological replicates. P values were calculated using Mann–Whitney U test. (E) NUF2 levels are reduced at the kinetochores in DNAJC9-depleted HeLa YFP-CENP-ALow cells. Top panel: Representative images of fixed cell immunofluorescence images showing the localization of NUF2 and CENP-A in metaphase cells transfected with siNeg or siDNAJC9.3. Scale bar: 5 µm. Bottom panel: Scatter plots showing NUF2 intensities at the kinetochore corrected for background. Indicated number of cells were analyzed from three biological replicates and each circle represents the value from an individual kinetochore. KTs refers to the total number of kinetochores measured per condition from three biological replicates. Mean with standard deviation is shown across all measurements. P values were calculated using Mann–Whitney U test. (F, G) Increased incidence of CIN phenotypes in HeLa YFP-CENP-ALow cells. Representative IF images showing micronuclei (F) and defects in chromosome segregation (G) indicated by white arrowheads in DNAJC9-depleted HeLa YFP-CENP-ALow cells. Scale bar: 15 µm. Bar graphs show percent cells with micronuclei (F) and defective chromosome segregation (G) in cells transfected with control (siNeg) or siDNAJC9.3. Mean with SD was plotted from three biological replicates and P value was calculated using unpaired t test. N denotes the total number of cells analyzed per condition. Source data are available online for this figure.

