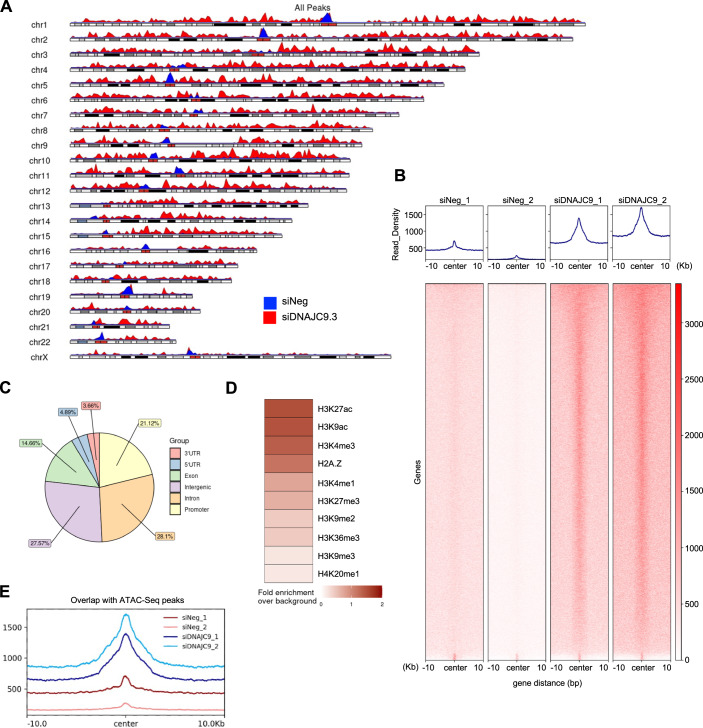
Figure 8. Genome-wide CUT&RUN analysis shows mislocalization of CENP-A to noncentromeric regions of DNAJC9-depleted RPE1 cells.
(A) Karyoplot of CENP-A CUT&RUN peak density, representing the distribution of the CENP-A identified in control siNeg (blue track) and siDNAJC9 (red track) treated RPE1-Tet-GFP-CENP-A cells. Plot represents the average from two biological replicates for each condition. (B) Heatmap of genes (N = 9253) associated with peaks identified by CUT&RUN sequencing of CENP-A in control (siNeg) and DNAJC9-depleted cells in DOX-treated RPE1-Tet-GFP-CENP-A cells in two biological replicates. Read density (z-score normalized) for each condition is shown above the heatmap and centered on the midpoint of the CENP-A peaks identified in DNAJC9-depleted cells. (C) Pie chart representing the distribution of the 17,341 significant common peaks identified in DNAJC9-depleted CENP-A CUT&RUN datasets across the indicated genomic features. (D) Heatmap showing the fold change of significantly enriched CENP-A CUT&RUN peaks in DNAJC9-depleted cells compared to control cells (siNeg), calculated for genomic loci associated with various epigenetic marks. (E) Read density plot showing CENP-A CUT&RUN peaks identified in indicated conditions that overlap with peaks from ATAC-Seq experiments published previously (GSM6383021, (Zhang et al, 2023)). Plots are centered on the midpoint of the peaks identified. Source data are available online for this figure.

