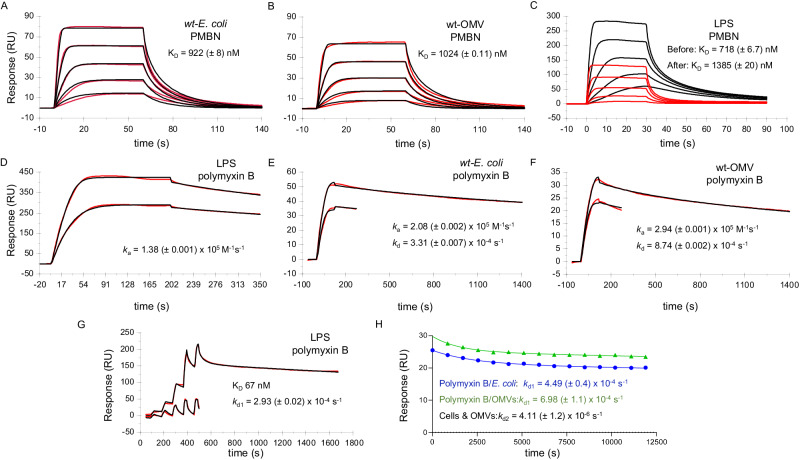
Fig. 3. Binding of polymyxin B and PMBN to E. coli cells, OMVs, and LPS and fitting to approximate kinetic models.
Affinity analysis of PMBN binding to (A) E. coli cells and (B) OMVs using a 1:1 kinetic boundary model fit (Eq. (S3)). C PMBN binding to LPS (black curves) and replicated (red curves) after pre-saturation of the surface with polymyxin B, as shown in (D). Both curve sets were fit to Eq. (S3) to estimate affinity. D Saturation of the LPS surface with polymyxin B repeated at two different LPS densities and fit to a simple 1:1 kinetic binding model. Binding of polymyxin B to (E) E. coli cells, and (F) OMVs fit to a 1:1 two-compartment binding model (Eq. (S2)). G Upper curve: binding of polymyxin B to LPS and fit to a two-state kinetic binding model (Eq. (S6)). Lower curve: replicate of upper curve where the LPS surface was pre-saturated with polymyxin B as shown in (D). H Polymyxin B dissociation curves for cells and OMVs pre-saturated with polymyxin B. Polymyxin B occupancy was obtained by chaser SPR analysis, where repeated PMBN injections report changes in polymyxin B occupancy allowing dissociation to be estimated at multiple timepoint readings that were then fit to a two-state dissociation model (Eq. (S7) and Supplementary Information Sections A and D).

