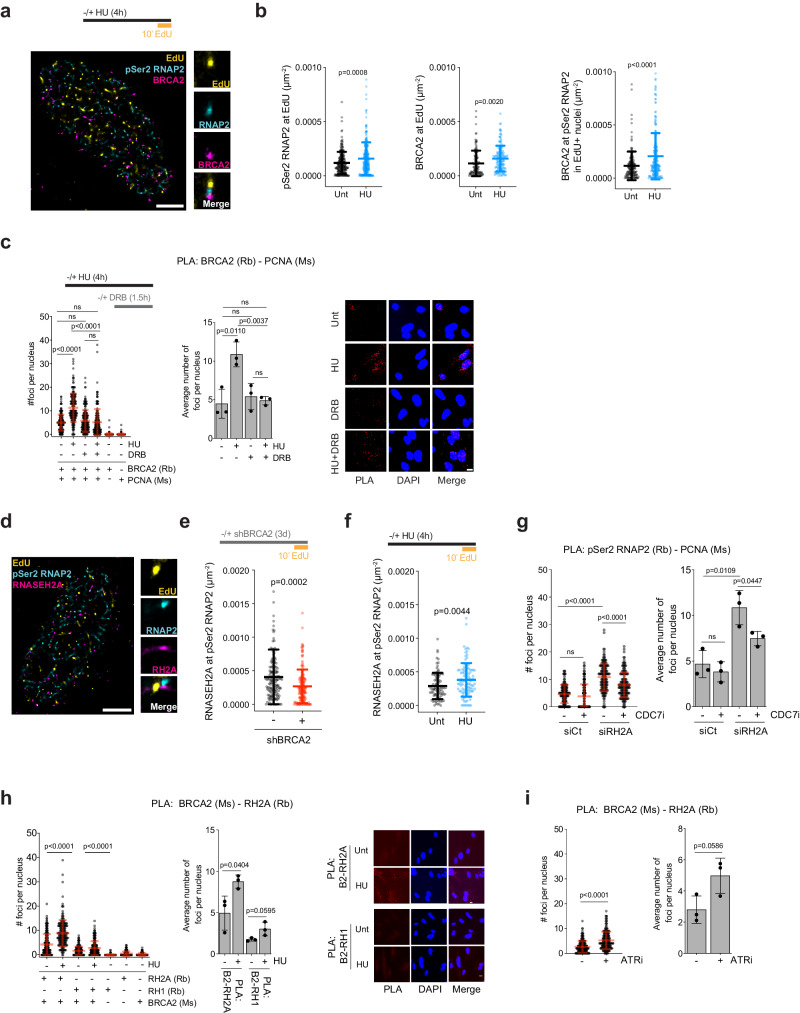
Fig. 4. BRCA2 and RNase H2 cooperate together to mitigate HO-TRCs.
a Representative SMLM images of EdU pulse-labeled FTEs ± 0.2 mM HU treatment (4 h) stained with pSer2-RNAP2 and BRCA2. Scale bar = 2 µm. b Scatter plot quantification measuring pSer2-RNAP2 at EdU in untreated and HU-treated FTEs (left; untreated, N = 234; HU, N = 255, where N = # of S-phase nuclei), BRCA2 at EdU (middle; untreated, N = 125; HU, N = 139), and BRCA2 at pSer2-RNAP2 (right; untreated, N = 162; HU, N = 219). p-values calculated using unpaired two-tailed t-tests of at least two biological replicates. Error bars = mean, std. c PLA of BRCA2 and PCNA in FTEs treated with 0.2 mM HU for 4 h, and/or 100 µM DRB for 90 min, including single antibody controls. The data presented shows 200 nuclei from 3 biological replicates. p-values calculated using unpaired two-tailed t-tests. Left: number of foci per nucleus. Right: average number of foci per nucleus per biological replicates. Error bars = mean, std. Scale bar = 10 µm in representative images. d Representative SMLM image of EdU pulse-labeled FTE cell stained with pSer2-RNAP2 and RNASEH2A. Scale bar = 2 µm. e Scatter plot quantification measuring RNASEH2A at pSer2-RNAP2 in EdU-labeled WT- and KD-BRCA2. p-values calculated using unpaired two-tailed t-test of at least two biological replicates. Unt, WT = 160; KD, N = 169, where N = # of S-phase nuclei. Error bars = mean, std. f Scatter plot quantification measuring RNASEH2A at pSer2-RNAP2 in EdU-labeled untreated and HU-treated FTEs. p-values calculated using unpaired two-tailed t-test of at least two biological replicates. Unt, N = 92; HU, N = 101. Error bars = mean, std. g PLA of pSer2-RNAP2 and PCNA in siControl or siRNASEH2A FTEs ± CDC7i. The data presented shows 150 nuclei from 3 biological replicates. p-values calculated using unpaired two-tailed t-tests. Left: number of foci per nucleus. Right: average number of foci per nucleus per biological replicates. Error bars = mean, std. h PLA of BRCA2 and RNASEH2A or BRCA2 and RNase H1 in FTEs ± 0.2 mM HU for 4 h, including single antibody controls for each PLA. The data presented shows 200 nuclei from 3 biological replicates. p-values calculated using unpaired two-tailed t-tests between conditions. Left: number of foci per nucleus. Right: average number of foci per nucleus per biological replicates. Error bars = mean, std. Scale bar = 10 µm in representative pictures. i PLA of BRCA2 and RNaseH2A or BRCA2 in FTEs ± ATRi. The data presented shows 200 nuclei from 3 biological replicates. p-values calculated using unpaired two-tailed t-tests between conditions. Left: number of foci per nucleus. Right: average number of foci per nucleus per biological replicates. Error bars = mean, std. Source data are provided as a Source Data file.

