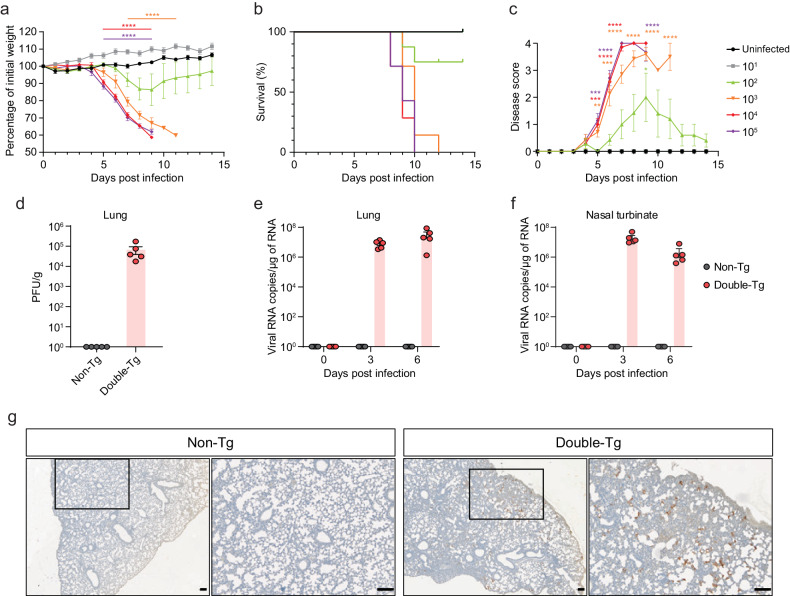
Fig. 3. SARS-CoV-2 infection in the double-transgenic (double-Tg) mice.
Percentage of initial weight (a), survival rate (b), and clinical disease symptoms (c) of the double-Tg mice infected with 1 × 101–105 PFU SARS-CoV-2. Clinical disease symptoms were scored as described in the “Materials and methods”. Infectious viral titers in the lungs (d) and viral burdens in the lungs (e) and nasal turbinate (f) of the double-Tg mice infected with 2 × 10³ PFU SARS-CoV-2 (6 days post-infection; dpi) were detected by using a plaque assay and RT-qPCR, respectively. g Representative images of SARS-CoV-2 nucleocapsid protein (NP) immunostaining in the lungs of C57BL/6 (non-Tg) and double-Tg mice. Images show low (left; bars, 100 μm) and high magnification (right; bars, 100 μm). Symbols represent means ± SEM. Statistically significant differences between the groups were determined using multiple two-tailed t-tests (a, c).

