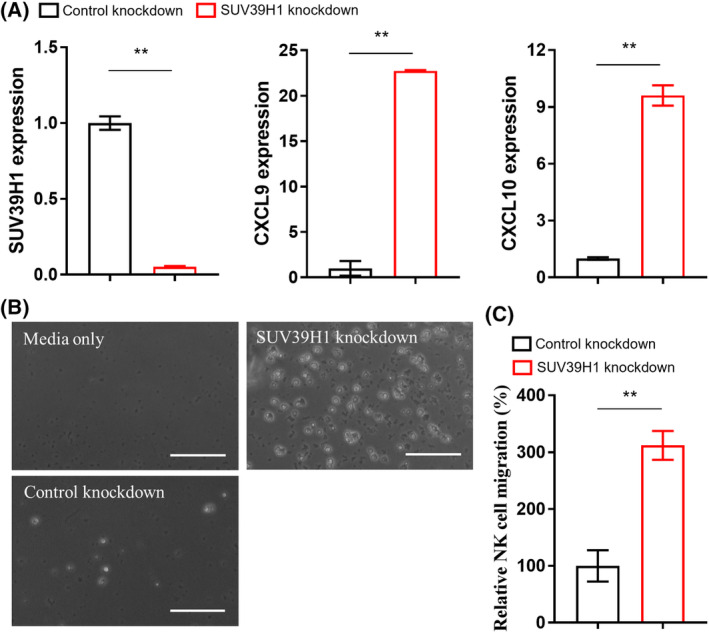
Fig. 3.

(A) qPCR detection of indicated gene expression in GSCs. Data represent mean ± SEM. **P < 0.01 by unpaired t test. (B) Representative images of the NK‐92MI cells that migrated into the lower compartment of the 24‐well plate. Scale bar, 100 μm. (C) Quantification of the migrated NK‐92MI cells in different fields (n = 4). Data represent mean ± SEM. **P < 0.01 by unpaired t test.
