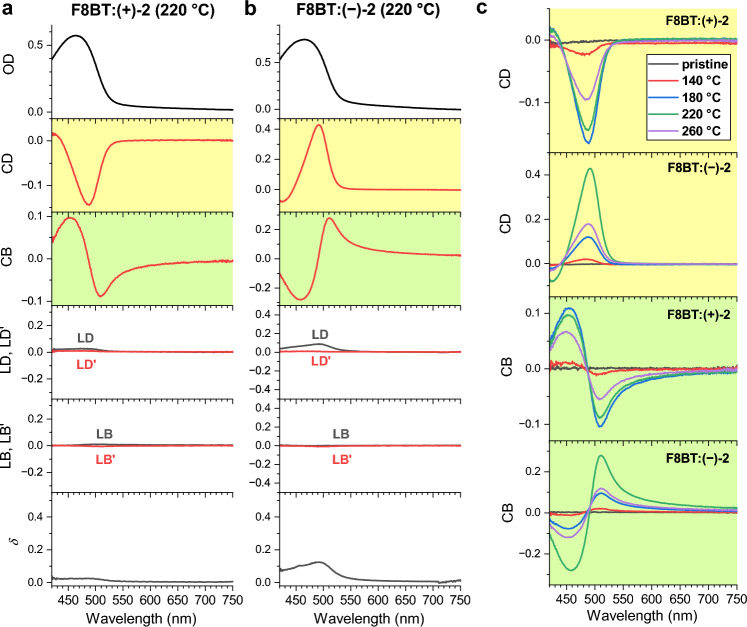
Figure 4.
Müller matrix spectra of F8BT:( +)-2 and F8BT:( −)-2 thin films. (a) OD, CD (yellow background), CB (green background), LD/LD’ and LB/LB’ response as well as the depolarisation parameter (from top to bottom) for a F8BT:( +)-2 thin film. (b) Same as in panel a, but for a F8BT:( −)-2 thin film. (c) Temperature-dependent CD and CB spectra for a pristine film (black) and thin films annealed at Tann = 140 °C (red), 180 °C (blue), 220 °C (green) and 260 °C (violet), where the upper two panels (yellow background) are for the CD spectra and the lower two panels (green background) are for the CB response of the different thin films.

