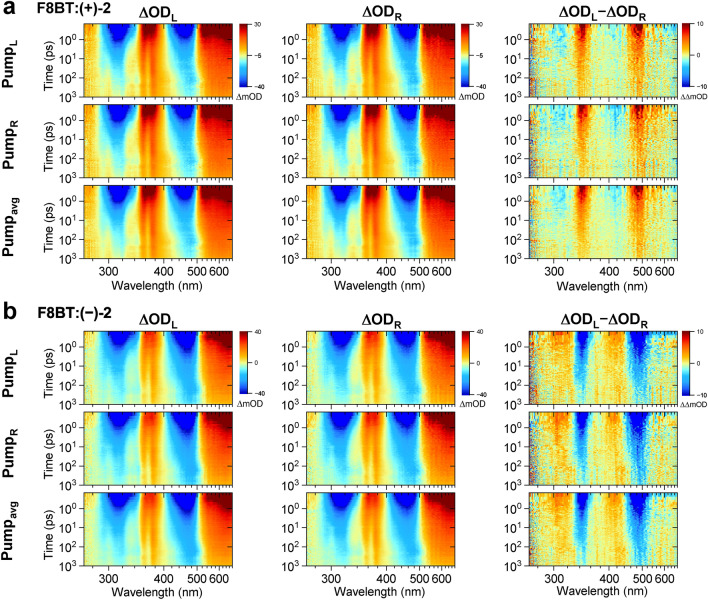
Figure 6.
Contour plots of transient spectra with pump modulation for chiral F8BT:( +)-2 and F8BT:( −)-2 thin film blends annealed at 220 °C. (a) Transient spectra of the F8BT:( +)-2 blend for excitation by an LCP pump pulse (first row) or an RCP pump pulse (second row), as well as for the average of LCP and RCP excitation representing random polarisation (third row). The first two columns show the transient absorption spectra probed by an LCP supercontinuum (ΔODL) and an RCP supercontinuum (ΔODR), respectively, and the third column displays the TrCD spectrum, which corresponds to the difference ΔODL − ΔODR. (b) Same as in panel a, but for the F8BT:( −)-2 blend. Pump wavelength: 400 nm. Note the logarithmic time axes.

