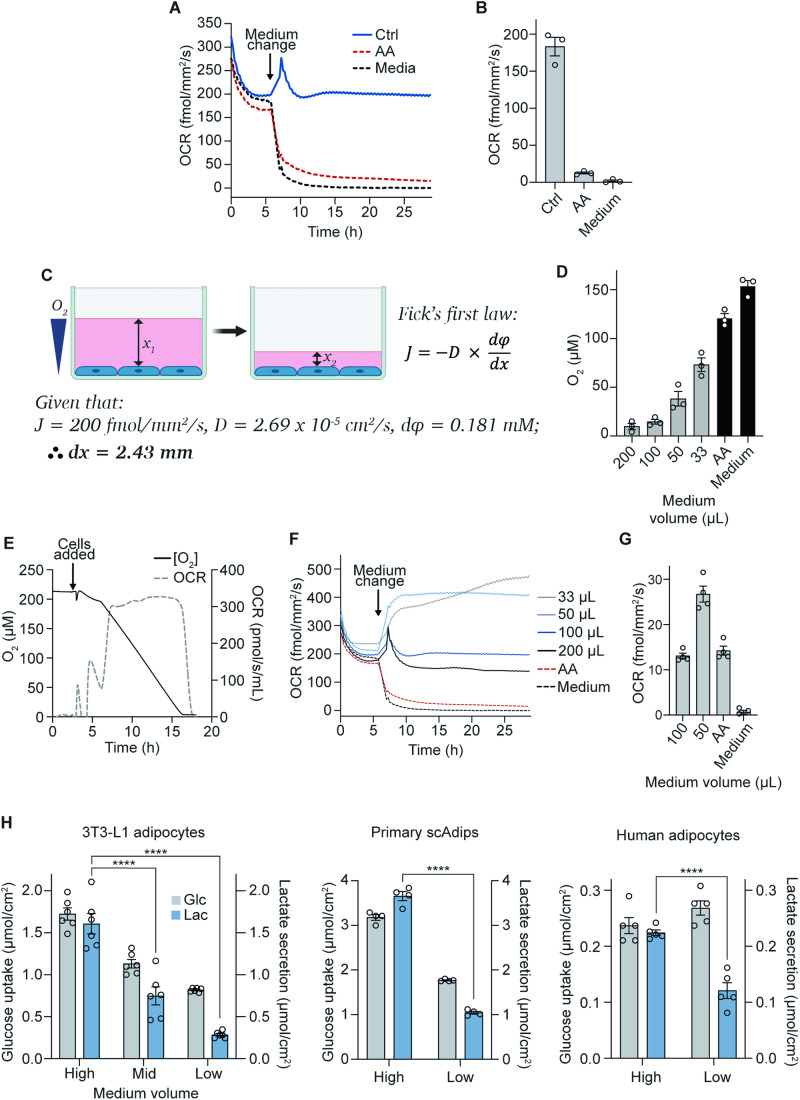
Figure 1. Oxygen is limiting for adipocyte respiration under standard culture conditions.
(A) 3T3-L1 adipocyte oxygen consumption rate (OCR) under control (100 µL), mitochondrial complex III inhibitor antimycin A (AA) treatment, or cell-free/medium-only conditions (96-well plate). Baseline OCR was measured for 6 h before starting AA treatment and removing cells from medium-only wells (representative of n = 3 biological replicates). (B) OCR measurements were taken after 20 h from (A) (n = 3 biological replicates). (C) Schematic representation of experimental setup and Fick’s first law of diffusion, which states that the rate of diffusion (J) is proportional to the concentration gradient (φ) and is inversely proportional to the diffusion length (x), where D is the diffusion coefficient. (D) Pericellular oxygen concentration at different medium volumes in 96-well plates (n = 3 biological replicates). (E) Oroboros measurements showing oxygen concentration and rate of OCR of 3T3-L1 adipocytes in a closed system (n = 3 biological replicates). (F) 3T3-L1 adipocyte OCR at different medium volumes, AA treatment, or medium-only conditions in 96-well plates. Baseline OCR (at 100 µL medium) was measured for 6 h before altering medium volumes or starting AA and medium-only treatments (representative of n = 3 biological replicates). (G) OCR under 1% oxygen with different medium volumes in 96-well plates (n = 4 biological replicates). (H) Extracellular medium glucose and lactate measurements from 3T3-L1 adipocytes (n = 6 biological replicates), primary subcutaneous white adipose tissue (scAdips) (n = 4 biological replicates), and human adipocytes (n = 5 biological replicates) 16 h after medium volume change. High = 1 mL, Mid = 0.67 mL, Low = 0.33 mL (in a 12-well plate) from hereafter unless stated otherwise. Data information: Data were represented as mean ± SEM (B, D, G, H). ****p < 0.0001 by two-way ANOVA with Šidák correction for multiple comparisons (H). See also Fig. EV1. Source data are available online for this figure.

