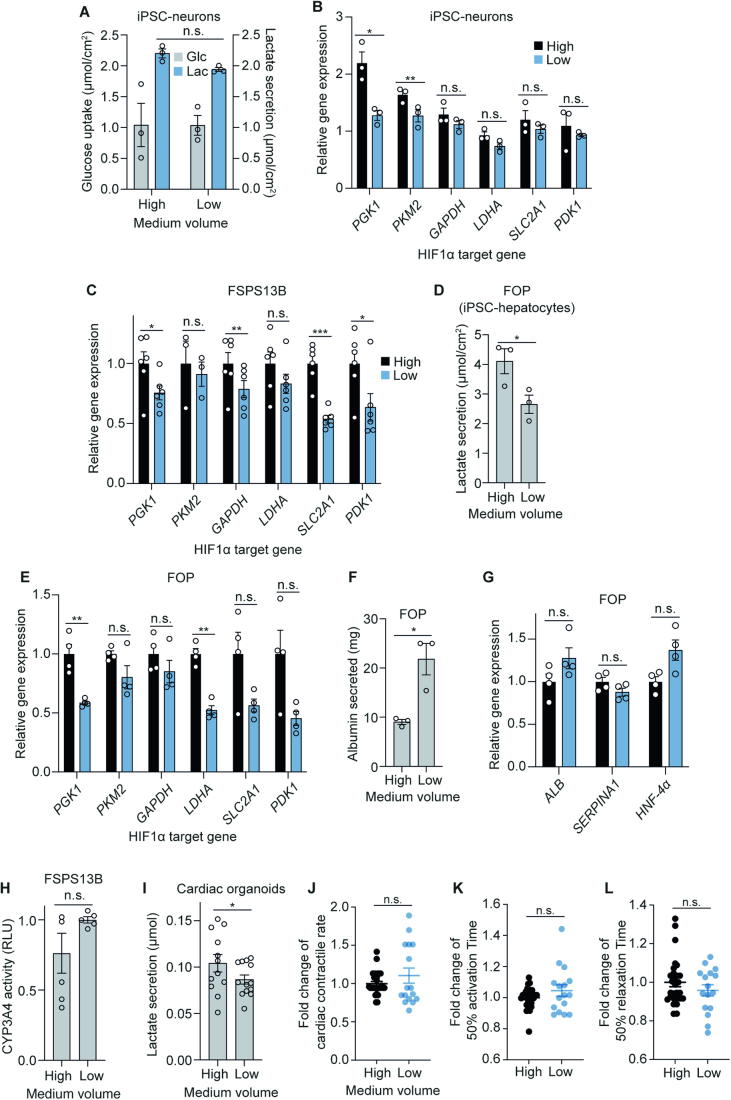
Figure EV5. Effects of low medium volumes on other primary and hPSC-derived cell types.
(A) Extracellular medium glucose and lactate measurements from iPSC-derived neurones after 16 h medium volume change in 6-well plates (n = 3 biological replicates). (B) Relative RNA expression of HIF1α target genes in iPSC-derived neurones after 16 h medium volume change in 12-well plates (n = 3 biological replicates). (C) Relative RNA expression of HIF1α target genes in FSPS13B hepatocytes cultured under different medium volumes in 12-well plates throughout differentiation (n = 3–6 biological replicates). (D) Lactate secretion in FOP hepatocytes after medium volume change in 12-well plates throughout differentiation (n = 3 biological replicates). (E) Relative RNA expression of HIF1α target genes in FOP hepatocytes cultured under different medium volumes in 12-well plates throughout differentiation (n = 4 biological replicates). (F) Albumin secretion over 24 h by FOP hepatocytes after medium volume change in 12-well plates throughout differentiation (n = 3 biological replicates). (G) Relative RNA expression of hepatocyte differentiation marker genes in FOP hepatocytes after medium volume change in 12-well plates throughout differentiation (n = 4 biological replicates). (H) Relative CYP3A4 activity in FSPS13B hepatocytes after medium volume change throughout differentiation (n = 5 biological replicates). (I) Lactate secretion by cardiac organoids after 48 h of medium volume change (n = 3–6 technical replicates from n = 3 biological replicates). High = 150 µL, Low = 50 µL. (J) Contractile rate (normalised) (n = 2–17 technical replicates from n = 4 biological replicates). (K) Time from 50% activation to peak (normalised) (n = 2–17 technical replicates from n = 4 biological replicates). (L) Time from peak to 50% relaxation (normalised) (n = 2–17 technical replicates from n = 4 biological replicates). Data information: All data were represented as mean ± SEM (A–L). n.s. non-significant; *p < 0.05, **p < 0.01, ***p < 0.001 by two-way ANOVA (A) or by paired/unpaired two-tailed Student’s t-test (B–L).

