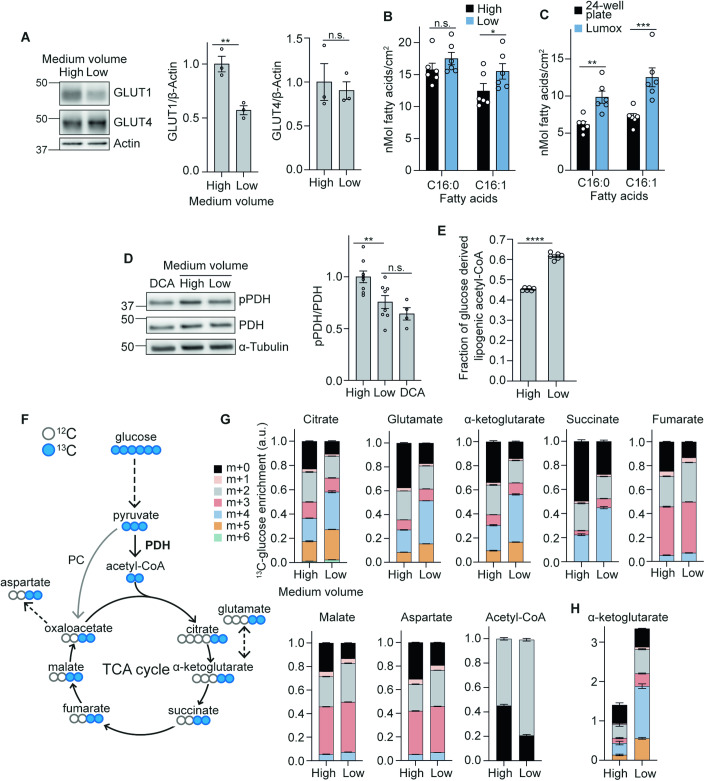
Figure 2. Lowering medium volumes increases mitochondrial glucose oxidation.
(A) Western blot and quantification of GLUT1 and GLUT4 after 16 h of medium volume change (n = 3 biological replicates). (B) De novo lipogenesis (DNL) of palmitate (C16:0) and palmitoleate (C16:1) during 16 h of culture in high or low medium volumes in 12-well plates (n = 6 biological replicates). (C) DNL of palmitate and palmitoleate after 16 h in 24-well or gas-permeable Lumox plates (n = 6 biological replicates). (D) Western blot and quantification of phospho-pyruvate dehydrogenase (pPDH) over total PDH after 16 h of medium volume change in 12-well plates, with dichloroacetate (DCA) as a positive control (n = 4–8 biological replicates). (E) Fraction of newly synthesised lipids after 16 h of medium volume change and U13C-glucose labelling in 12-well plates (n = 6 biological replicates). (F) Schematic of 13C enrichment in TCA cycle metabolites after one cycle of U13C-glucose labelling. PC, pyruvate carboxylase. (G) Graphs show the fractional abundance of each isotopologue after 16 h medium volume change (n = 4–6 biological replicates). (H) Total abundance of α-ketoglutarate after 16 h medium volume change (n = 4–6 biological replicates). Data information: Data were represented as mean ± SEM (A–E, G, H). n.s. non-significant; *p < 0.05, **p < 0.01, ****p < 0.0001 by paired two-tailed Student’s t-test (A, D and E) or by two-way ANOVA with Šidák correction for multiple comparisons (B, C). See also Fig. EV2. Source data are available online for this figure.

