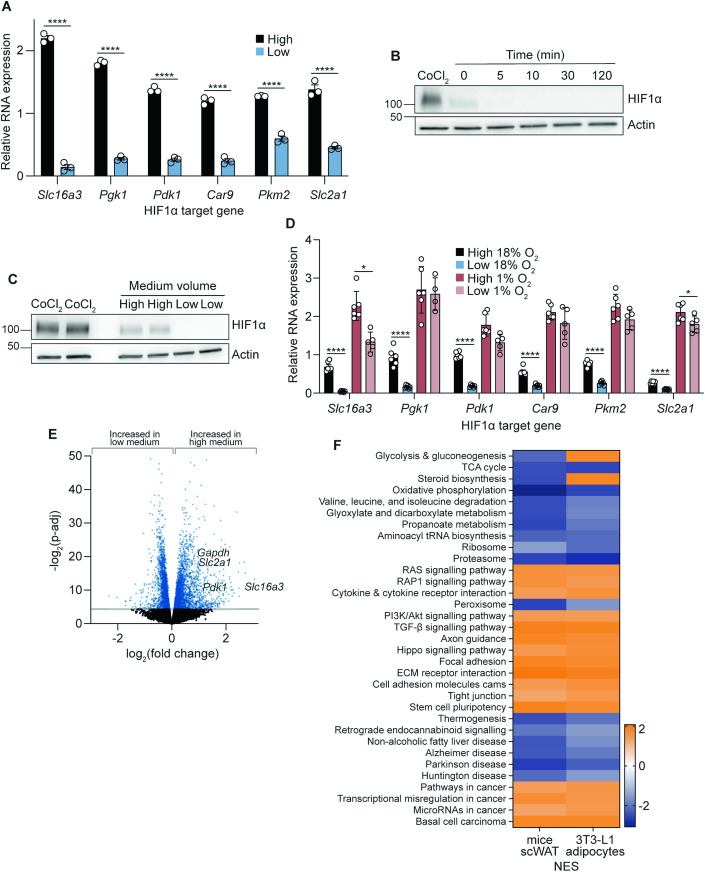
Figure 3. Lowering medium volumes induces a widespread transcriptional response reminiscent of physiological hypoxia.
(A) Relative RNA expression of HIF1α target genes after 16 h medium volume change in 12-well plates (n = 3 biological replicates). (B) Western blot of hypoxia-inducible factor (HIF) 1α at various time points after the transition to low medium volumes in 12-well plates, with 500 µM CoCl2 as a positive control (n = 3 biological replicates). (C) Western blot of HIF1α after 16 h medium volume change in 12-well plates, with 500 µM CoCl2 as positive control (n = 3 biological replicates). (D) Relative RNA expression of HIF1α target genes cultured in either 1 or 18% incubator oxygen for 16 h with different medium volumes in 12-well plates (n = 4–6 biological replicates). (E) Volcano plot of differentially expressed genes after 16 h medium volume change in 12-well plates (n = 6 biological replicates). (F) KEGG pathway analyses of 3T3-L1 adipocytes after 16 h medium volume change in 12-well plates (n = 6 biological replicates) and subcutaneous white adipose tissue (scWAT) from mice kept in 10 or 21% oxygen for 4 weeks (n = 10 biological replicates). Orange (positive NES) represents upregulated KEGG pathways in high medium (3T3-L1 adipocytes) or in 10% oxygen (mice scWAT). Blue (negative NES) represents upregulated KEGG pathways in low medium (3T3-L1 adipocytes) or in 21% oxygen (mice scWAT). NES, normalised enrichment score. Data information: Data were represented as mean ± SEM (A, D). *p < 0.05, ****p < 0.0001 by paired Student’s t-tests (A, D). p-adj threshold of 0.05 in (E) is the adjusted p value after controlling for the false discovery rate (FDR) with the Benjamini–Hochberg procedure. The raw p values were determined using the Wald test. See also Fig. EV3. Source data are available online for this figure.

