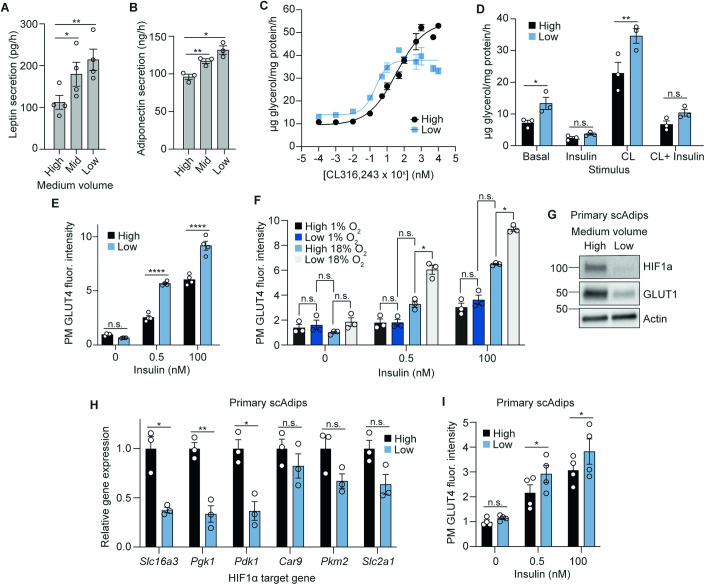
Figure 4. Lowering medium volumes improves adipocyte function in both 3T3-L1s and scAdips.
(A) Rate of leptin secretion under different medium volume conditions in 12-well plates (n = 4 biological replicates). (B) Rate of adiponectin secretion under different medium volume conditions in 12-well plates (n = 3 biological replicates). (C) Dose-response curve of the lipolytic drug, CL316,243 treatment in 12-well plates (n = 3–7 biological replicates). (D) Rate of lipolysis measured by glycerol release, upon 100 nM insulin or 1 nM CL316,243 stimulation (n = 3 biological replicates). (E) Fluorescence intensity of plasma membrane (PM) GLUT4 upon insulin stimulation after 48 h medium volume change in 96-well plates (n = 4 biological replicates). (F) Fluorescence intensity of PM GLUT4 upon insulin stimulation after 48 h culture in either 1 or 18% incubator oxygen with medium volume changes in 96-well plates (n = 3 biological replicates). (G) Western blot of HIF1α and GLUT1 from primary scAdips after 16 h medium volume change (12-well plate), with 500 µM CoCl2 as positive control (n = 4 biological replicates). (H) Relative RNA expression of HIF1α target genes in primary scAdips after 16 h medium volume change (12-well plate) (n = 3 biological replicates). (I) Fluorescence intensity of primary scAdips PM GLUT4 upon insulin stimulation after 48 h medium volume change in 96-well plates (n = 4 biological replicates). Data information: Data were represented as mean ± SEM (A, B, D–F, H, I). n.s. non-significant; *p < 0.05, **p < 0.01, ****p < 0.0001 by one/two-way ANOVA with Šidák correction for multiple comparisons (A, B, D–F and I), or by paired Student’s t-tests (H). See also Fig. EV4. Source data are available online for this figure.

