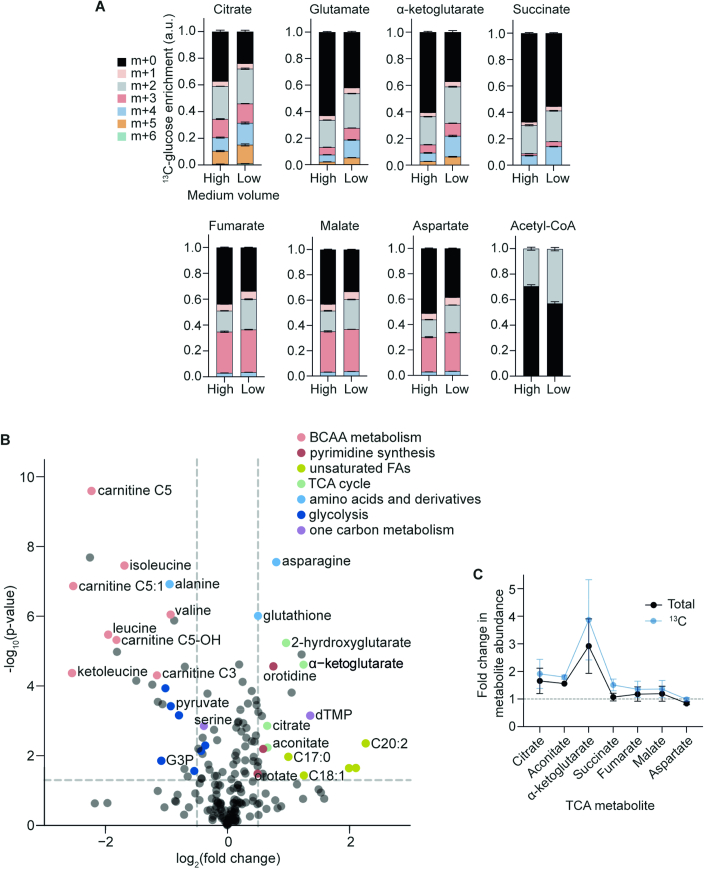
Figure EV2. Lowering medium volumes rewires cellular metabolism.
(A) Fractional abundance of each isotopologue after 4 h medium volume change (n = 6 biological replicates). (B) Volcano plot of differentially regulated metabolites after 16 h medium volume change. Metabolites of interest which are significantly changed (p < 0.05) are highlighted according to their metabolic pathways (n = 6 biological replicates). BCAA branched-chain amino acid, FA fatty acid, G3P glyceraldehyde−3−phosphate. (C) Fold change of total and U13C-glucose labelled TCA metabolite abundance after 16 h medium volume change in 12-well plates (n = 4 biological replicates). Data information: Data were represented as mean ± SEM (A, C). p value threshold of 0.05 (B) was determined using differential metabolite analysis (DMA) with Student’s t-test.

