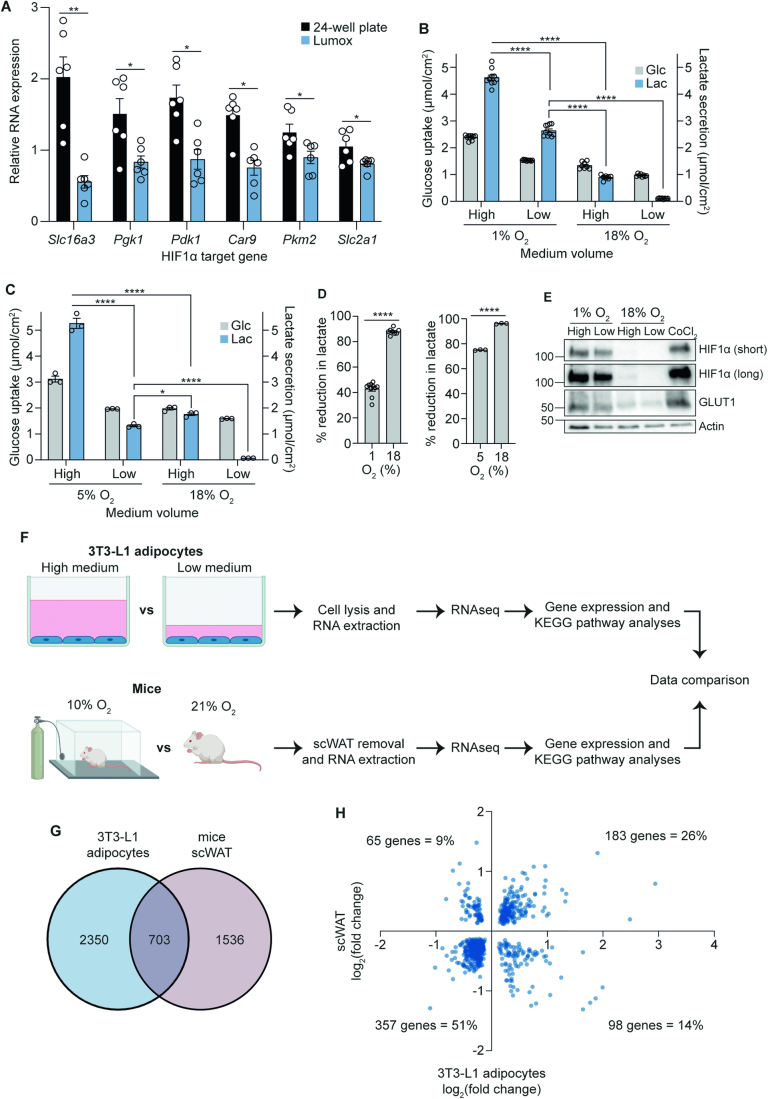
Figure EV3. Reducing oxygen availability causes metabolic and transcriptional rewiring.
(A) Relative RNA expression of HIF1α target genes in 3T3-L1 adipocytes cultured in either 24-well or gas-permeable Lumox plates (n = 6 biological replicates). (B) Extracellular medium glucose and lactate measurements after 16 h medium volume change (12-well plate) in 1 or 18% oxygen incubators (n = 8–10 biological replicates). (C) Extracellular medium glucose and lactate measurements after 16 h medium volume change (12-well plate) in 5 or 18% oxygen incubators (n = 3 biological replicates). (D) Percentage reduction in lactate production calculated from Fig. EV3B (1% O2) (n = 8–10 biological replicates) and EV3C (5% O2) (n = 3 biological replicates). (E) Western blot of HIF1α (after both short and long imaging exposures) and GLUT1 after 16 h medium volume change at 1 or 18% O2 in 12-well plates (n = 3 biological replicates). (F) Schematic representation of the RNAseq experimental workflow. RNA extracted from 3T3-L1 adipocytes (cultured in high or low medium for 16 h in 12-well plates) or scWAT (obtained from mice kept in 10 or 21% O2 for 4 weeks) were sequenced. The two sets of analysed data were then compared. (G) Venn diagram showing the overlapping differentially expressed genes (p-adj < 0.05) from both 3T3-L1 adipocytes (high vs low medium) (n = 6 biological replicates) and mice scWAT (10 vs 21% O2) (n = 10 biological replicates). (H) Fold change of the 703 differentially expressed genes in 3T3-L1 adipocytes (y-axis) and mice scWAT (x-axis) from the intersection in Fig. EV3D, showing a 77% directional concordance. Data information: Data were represented as mean ± SEM (A–D). *p < 0.05, **p < 0.01, ****p < 0.0001 by two-way ANOVA with Šidák correction for multiple comparisons (B, C), or by paired/unpaired Student’s t-tests (A, D).

