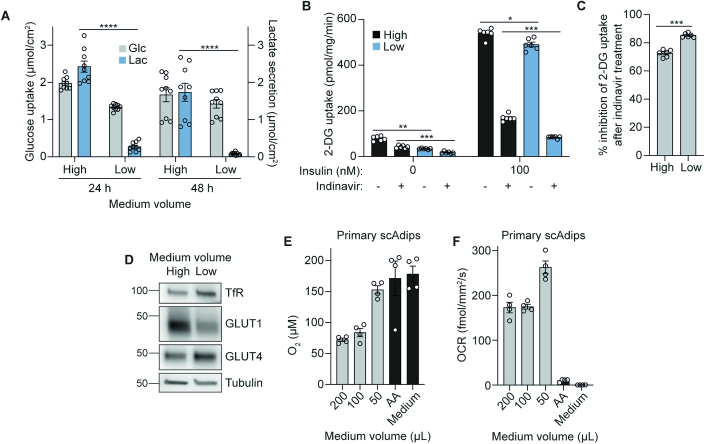
Figure EV4. Effects of lowering medium volumes on 3T3-L1 adipocyte glucose metabolism and oxygen use in primary scAdips.
(A) Extracellular measurements of 3T3-L1 medium glucose and lactate 24 or 48 h after medium volume change in 12-well plates (n = 3 technical replicates from n = 3 biological replicates). (B) 2-deoxyglucose (DG) uptake after insulin stimulation and 200 µM indinavir (GLUT4 inhibitor) treatment. Cells were cultured in high or low medium for 48 h in 24-well plates prior to the experiment (n = 6 biological replicates). (C) Percentage inhibition of 2-DG uptake after indinavir treatment, calculated from the difference between +/− indinavir treated conditions, as a percentage of -indinavir 2-DG uptake upon 100 nM insulin stimulation. Graph shows the percentage of 2-DG uptake that is GLUT4-dependent (i.e. inhibited by indinavir) (n = 6 biological replicates). (D) Western blot of GLUT1 and GLUT4 in 3T3-L1s after 48 h medium volume change (12-well plate) (n = 6 biological replicates). (E) The pericellular oxygen concentration of primary scAdips cultured with different medium volumes in 96-well plates (n = 4 biological replicates). AA antimycin A. (F) OCR of primary scAdips cultured with different medium volumes in 96-well plates (n = 4 biological replicates). Data information: Data were represented as mean ± SEM (A–D). *p < 0.05, **p < 0.01, ***p < 0.001, ****p < 0.0001 by two-way ANOVA with Šidák correction for multiple comparisons (A. B), or by paired two-tailed Student’s t-test (C).

