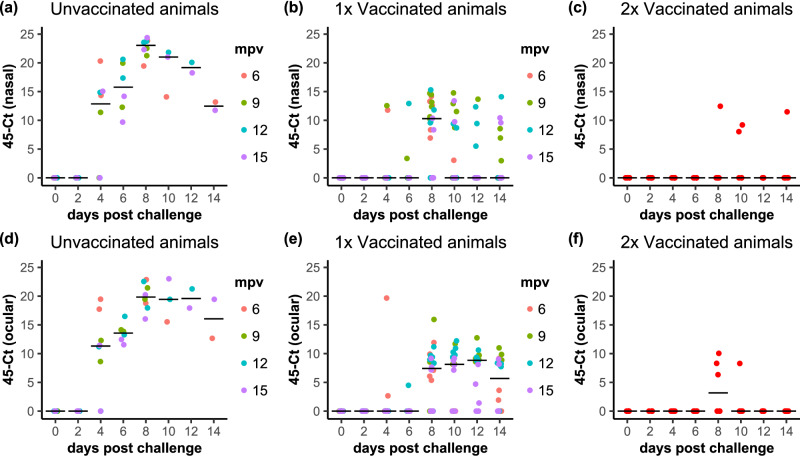
Fig. 8. PPRV detection by RT-qPCR in nasal and ocular swabs from infected animals.
The results of the PCR analysis are shown, plotted as 45-Ct; (a–c): nasal swabs, (d–f); ocular swabs. a, d Unvaccinated, (b, e) single-vaccinated and (c, f) double-vaccinated animals. (a, b, d, e) the data points for each animal are coloured according to the time post vaccination at which those animals were challenged. a–f The position of the median value of all the samples at each time point is indicated by a horizontal bar.

