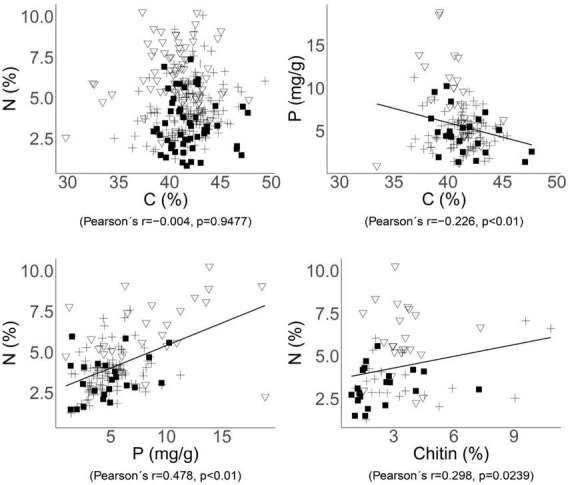
FIGURE 2.

Relationships between the C, N, P, and chitin contents in fungal biomass. Significant trends across the whole dataset are indicated by correlations with Pearson’s correlation coefficients and p-values. Each point represents one species of ectomycorrhizal (cross), soil saprotrophic (triangle), or wood saprotrophic (square) fungi.
