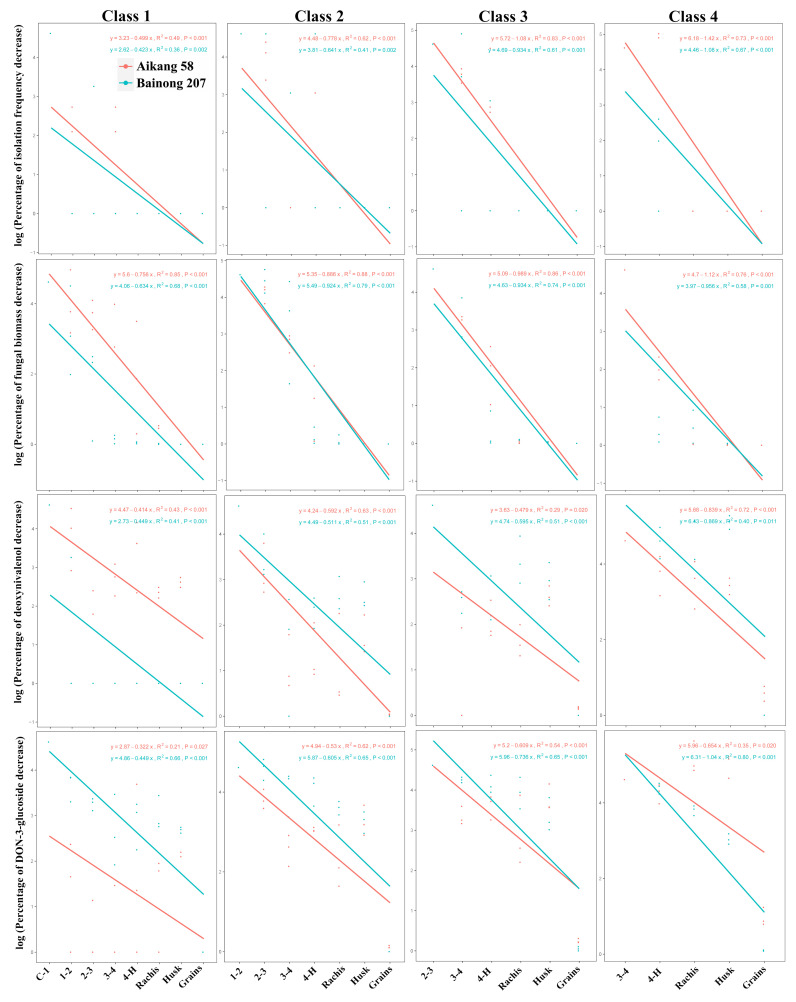
Figure 3.
Linear relationship between the logarithm of the percentage of decrease in isolation frequency of Fusarium pseudograminearum, F. pseudograminearum biomass, DON content, and D3G content per sample (n = 3) vs. distance from the internode with disease symptoms, disease severity classes, and cultivar.

