
FIGURE 9.
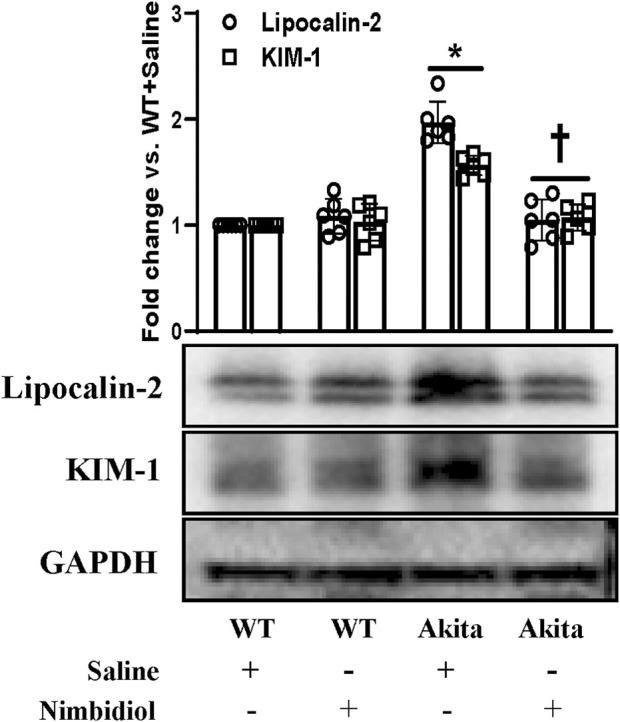
Nimbidiol treatment mitigated the expression of lipocalin-2 and KIM-1 in the diabetic kidney. Western blot analyses showing protein expressions of lipocalin-2 and KIM-1 in kidney. The bar diagram represents the fold change vs. WT + Saline. Data are mean ± SD (n = 6/group). *p < 0.05 vs. WT + Saline, WT + Nimbidiol and Akita + Nimbidiol, † p < 0.05 vs. Akita + Saline.