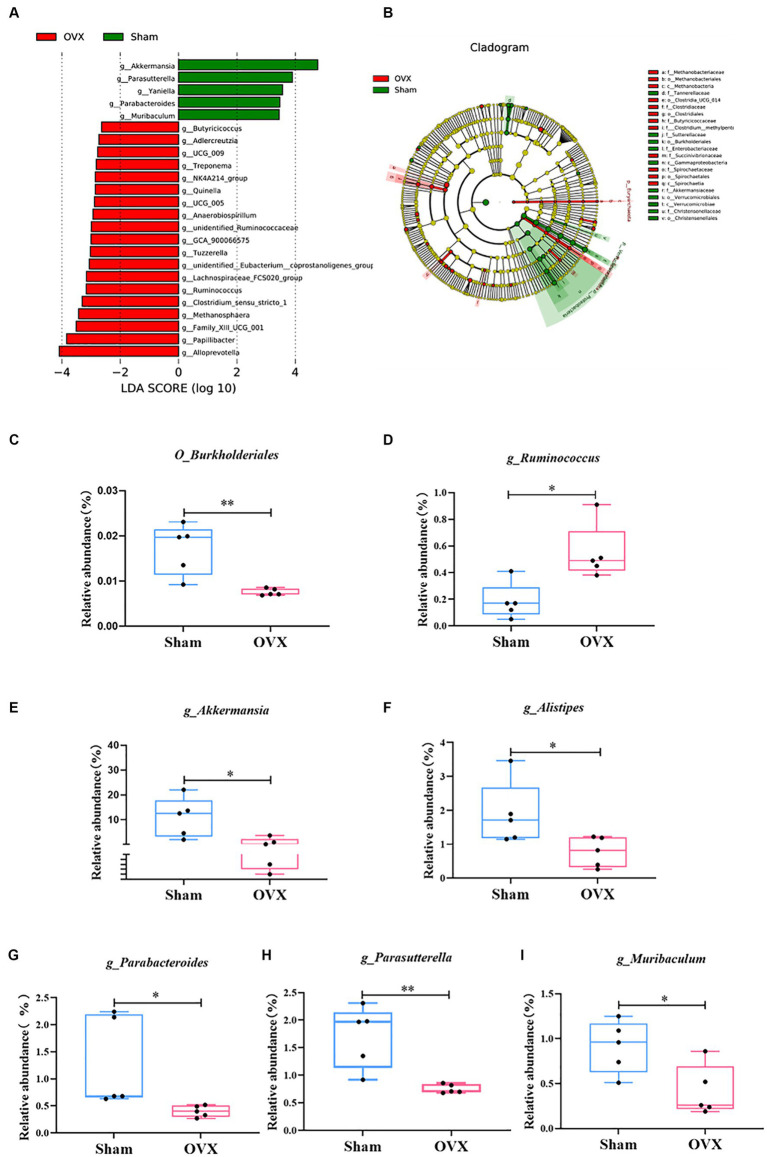
Figure 5.
LEfSe multilevel discriminant analysis of species differences. LEfSe analysis histogram (A); LEfSe analysis evolutionary branching diagram (B); O_Burkjolderiales (C); g_Ruminococcus (D); g_Akkermansia (E); g_Alistipes (F); g_Parabacteroides (G); g_Parasutterella (H); g_Muribaculum (I). Data are expressed as mean ± SD (n = 5). One-way ANOVA procedure followed by Tukey test was used to evaluate the statistical significance, *p < 0.05 and **p < 0.01.

