Figure 5.
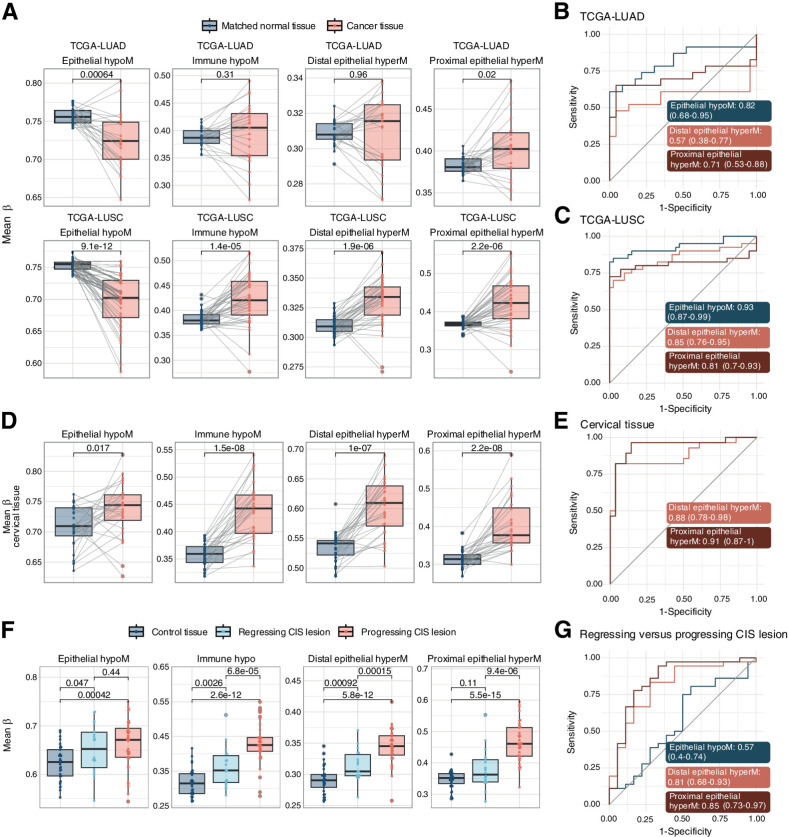
Mean methylation beta of smoking-associated CpG sets in cancer tissue and progressing versus regressing CIS lesions. A, Mean methylation beta values in each set in TCGA LUAD and LUSC projects. Only samples with matched normal control tissue were included to control for smoking exposure. P values are derived from a paired Wilcoxon test. B and C, AUC plots for mean methylation levels in epithelial hypoM, distal epithelial hyperM, and proximal epithelial hyperM, comparing matched control tissue versus lung cancer tissue in TCGA-LUAD (B) and TCGA-LUSC (C). D, Mean methylation beta values in each set in cervical cancer or matched normal tissue (GSE211668). Only samples with matched normal control tissue were included to control for smoking exposure. P values are derived from a paired Wilcoxon test. E, AUC plots for mean methylation levels in epithelial hypoM, distal epithelial hyperM, and proximal epithelial hyperM, comparing matched control tissue versus cervical cancer tissue (GSE211668). F, Mean methylation beta values in the smoking-associated CpG sets in control lung tissue, regressing CIS lesions, or progressing CIS lesions. P values are derived from paired Wilcoxon tests. G, AUC plots for mean methylation levels in epithelial hypoM, distal epithelial hyperM, and proximal epithelial hyperM, comparing matched regressing CIS versus progressing CIS lesions.

