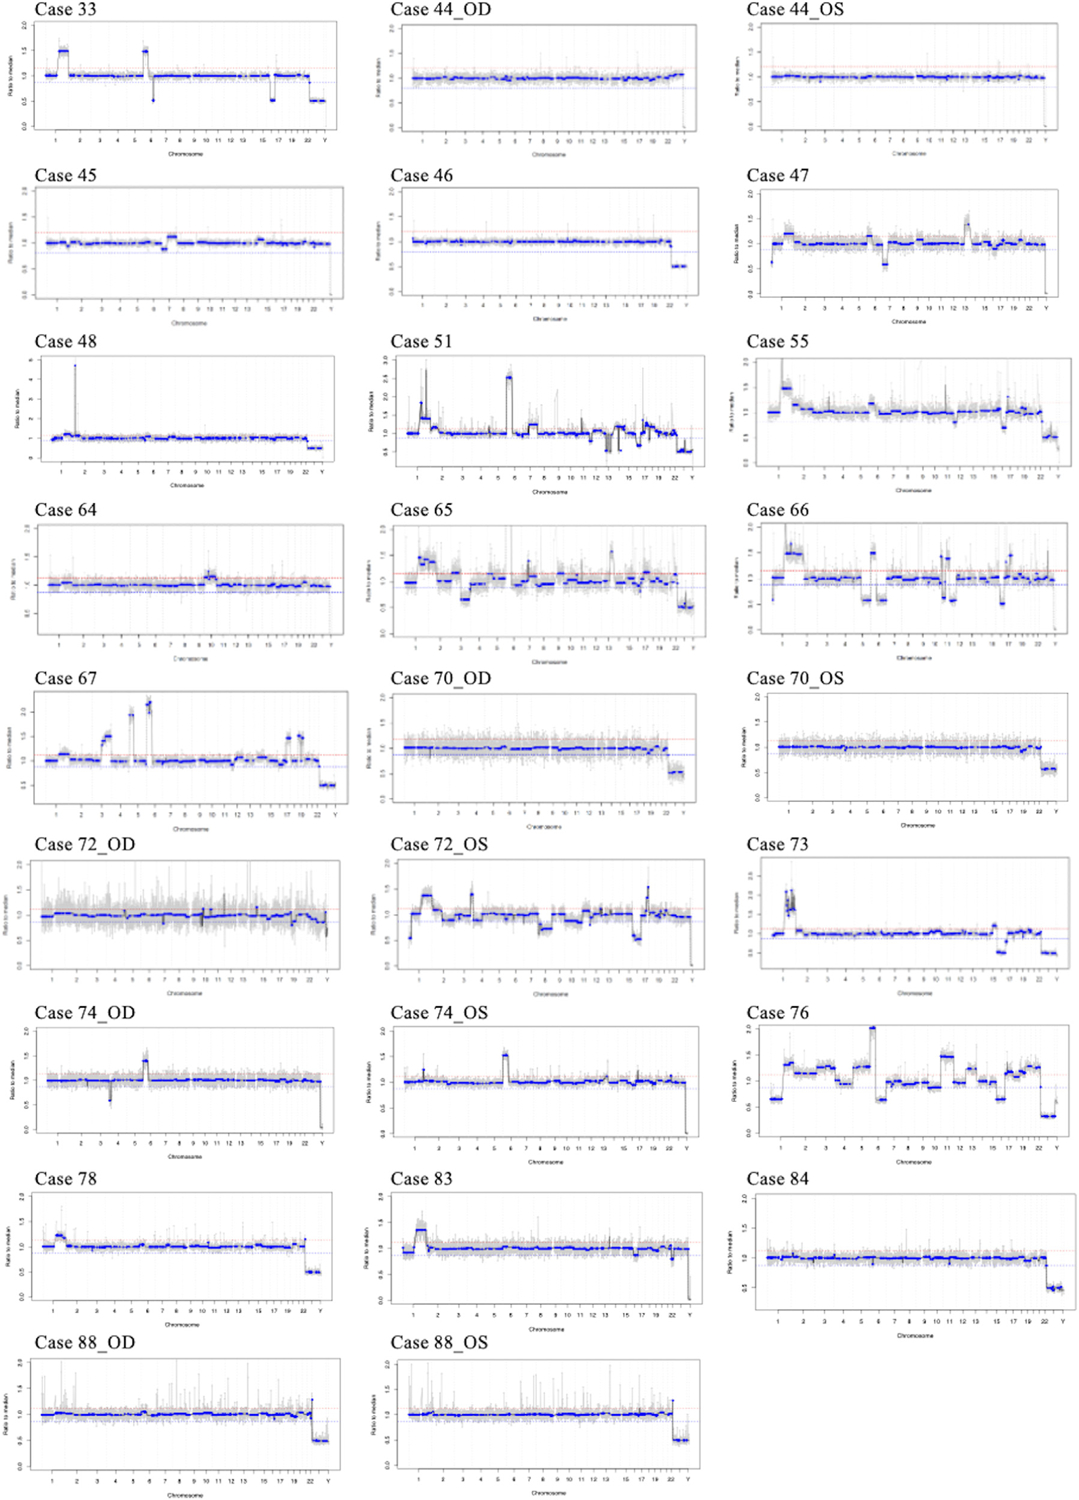
FIGURE 2.

Retinoblastoma genomic profiles from the aqueous humor liquid biopsy. The diagnostic genomic profile from each eye is shown; the x-axis shows the chromosomal location, the y-axis demonstrates the copy number values that are recorded as ratios to the median (relative to a baseline human genome), with values ≤0.87 representing copy number losses and values ≥1.15 representing copy number gains equal to 20% deflection from the human genome (red line).
