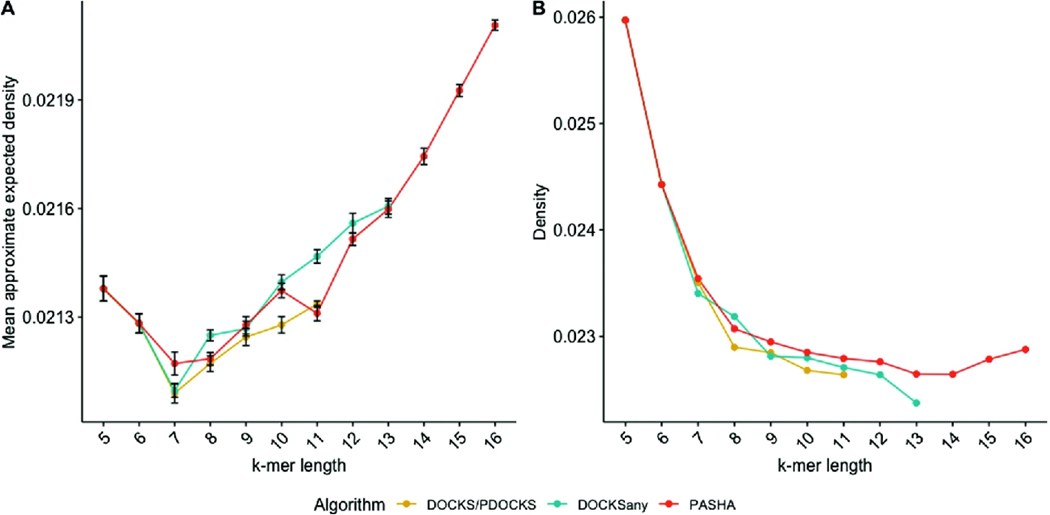
Fig. 3.
Mean approximate expected density (A), and density on the human reference genome (B) for different methods, for and . Error bars represent one standard deviation from the mean across 10 random sequences of length 106. Density is the fraction of selected -mer positions over the number of -mers in the sequence.

