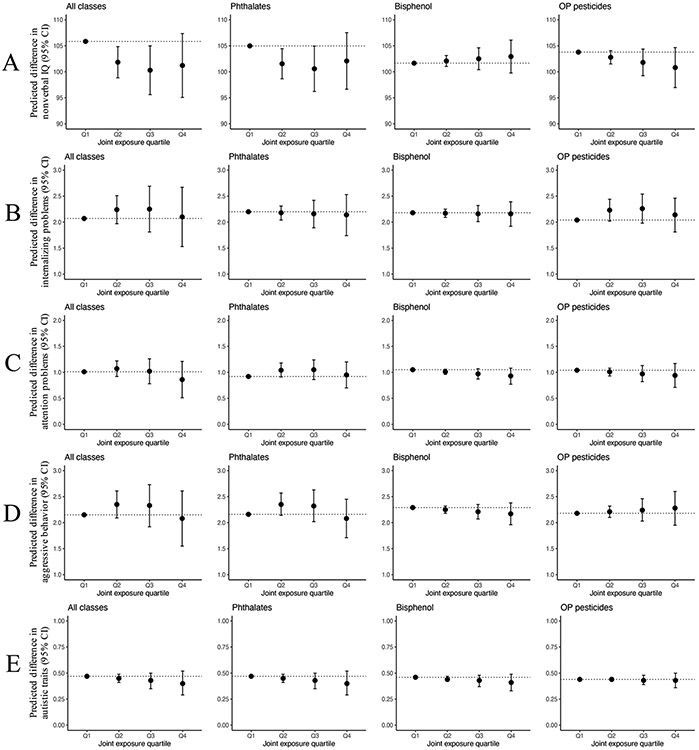
Figure 2.
Adjusted difference (95% confidence interval) in estimated outcome for each exposure quartile (Q2–Q4) compared to the lowest quartile (Q1) in all chemicals measured and within each chemical class. Corresponding numeric data are reported in SI Table S7. Each row corresponds to a different mixture model with a different outcome (A: Nonverbal IQ. B: Internalizing problems, C: Attention problems. D: Aggressive behavior. E: Autistic traits). Adjusted for fetal sex, maternal age, maternal prepregnancy bmi, maternal education level, maternal ethnicity, household income, marital status, parity, maternal smoking, maternal alcohol use, maternal IQ, and child age at assessment. Models for internalizing problems, attention problems, aggressive behavior, and autistic traits are additionally adjusted for maternal psychopathology. Models of the phthalate metabolite mixture additionally adjusted for log 10-transformed pregnancy-averaged concentrations of bisphenol A and the OP pesticide metabolites. Models of bisphenol (bisphenol A) additionally adjusted for log 10-transformed pregnancy-averaged concentrations of phthalate and OP pesticide metabolites. Models of the OP pesticide metabolite mixture additionally adjusted for log 10-transformed pregnancy-averaged concentrations of phthalate metabolites and bisphenol A.

