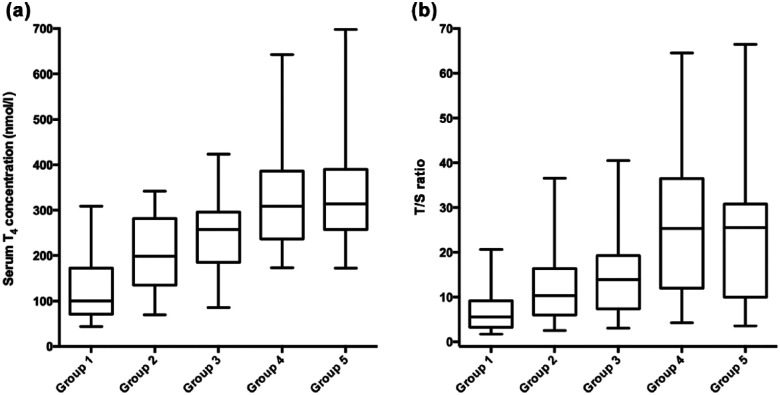
Figure 1.
Box plots of (a) serum thyroxine (T4) concentrations and (b) thyroid to salivary (T/S) ratios in 2096 cats with hyperthyroidism, divided into the following five groups based on the time interval from diagnosis of hyperthyroidism to thyroid scintigraphy: group 1 (n = 1773) ⩽1 year; group 2 (n = 169) >1–2 years; group 3 (n = 88) >2–3 years; group 4 (n = 35) >3–4 years; and group 5 (31 cats) >4–6.1 years. In each graph, the box represents the interquartile range (ie, 25th–75th percentile range or the middle half of the data). The horizontal bar in the box represents the median value. For each box plot, the T-bars represent the 2.5–97.5th percentile range

