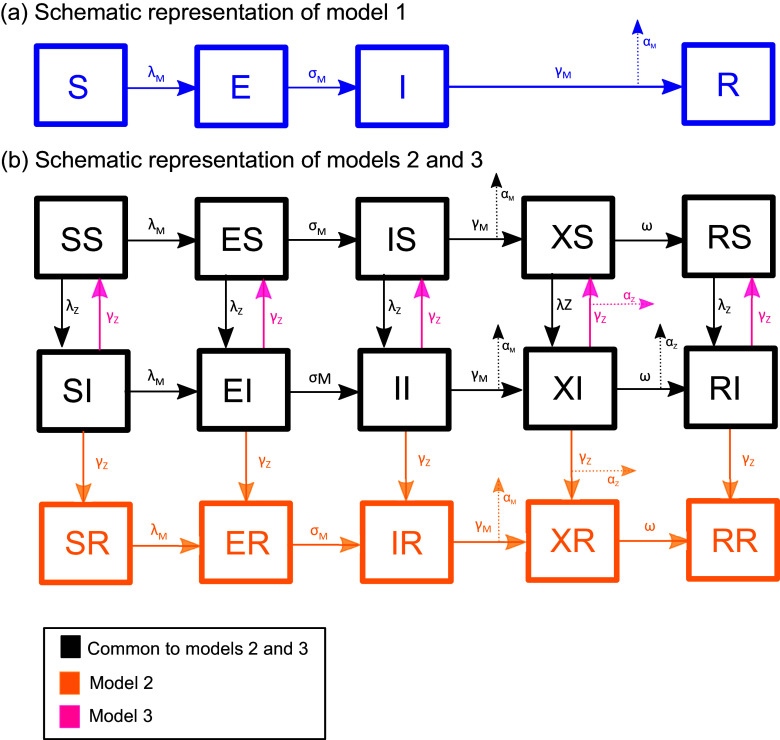
Figure 1.
Schematic diagram of compartmental models 1–3. Model 1 is shown in panel (a), and models 2 and 3 are shown in panel (b). Each box represents a different state in which an individual can exist (see Methods for how these are defined). Solid arrows represent the rates of transition between different states. Dotted arrows represent losses due to infectious disease mortality. Specifically, the symbols αM and αZ represent proportions of those who would have transitioned between two states, but in fact died from acute measles (αM) or infection whilst immunosuppressed (αZ). Definitions of all rate symbols used are given in Table 1, with the exception of the symbols λM and λZ, which represent the force of infection with measles and the secondary infectious agent, respectively, and are defined with the model equations in the Supplementary Material.

