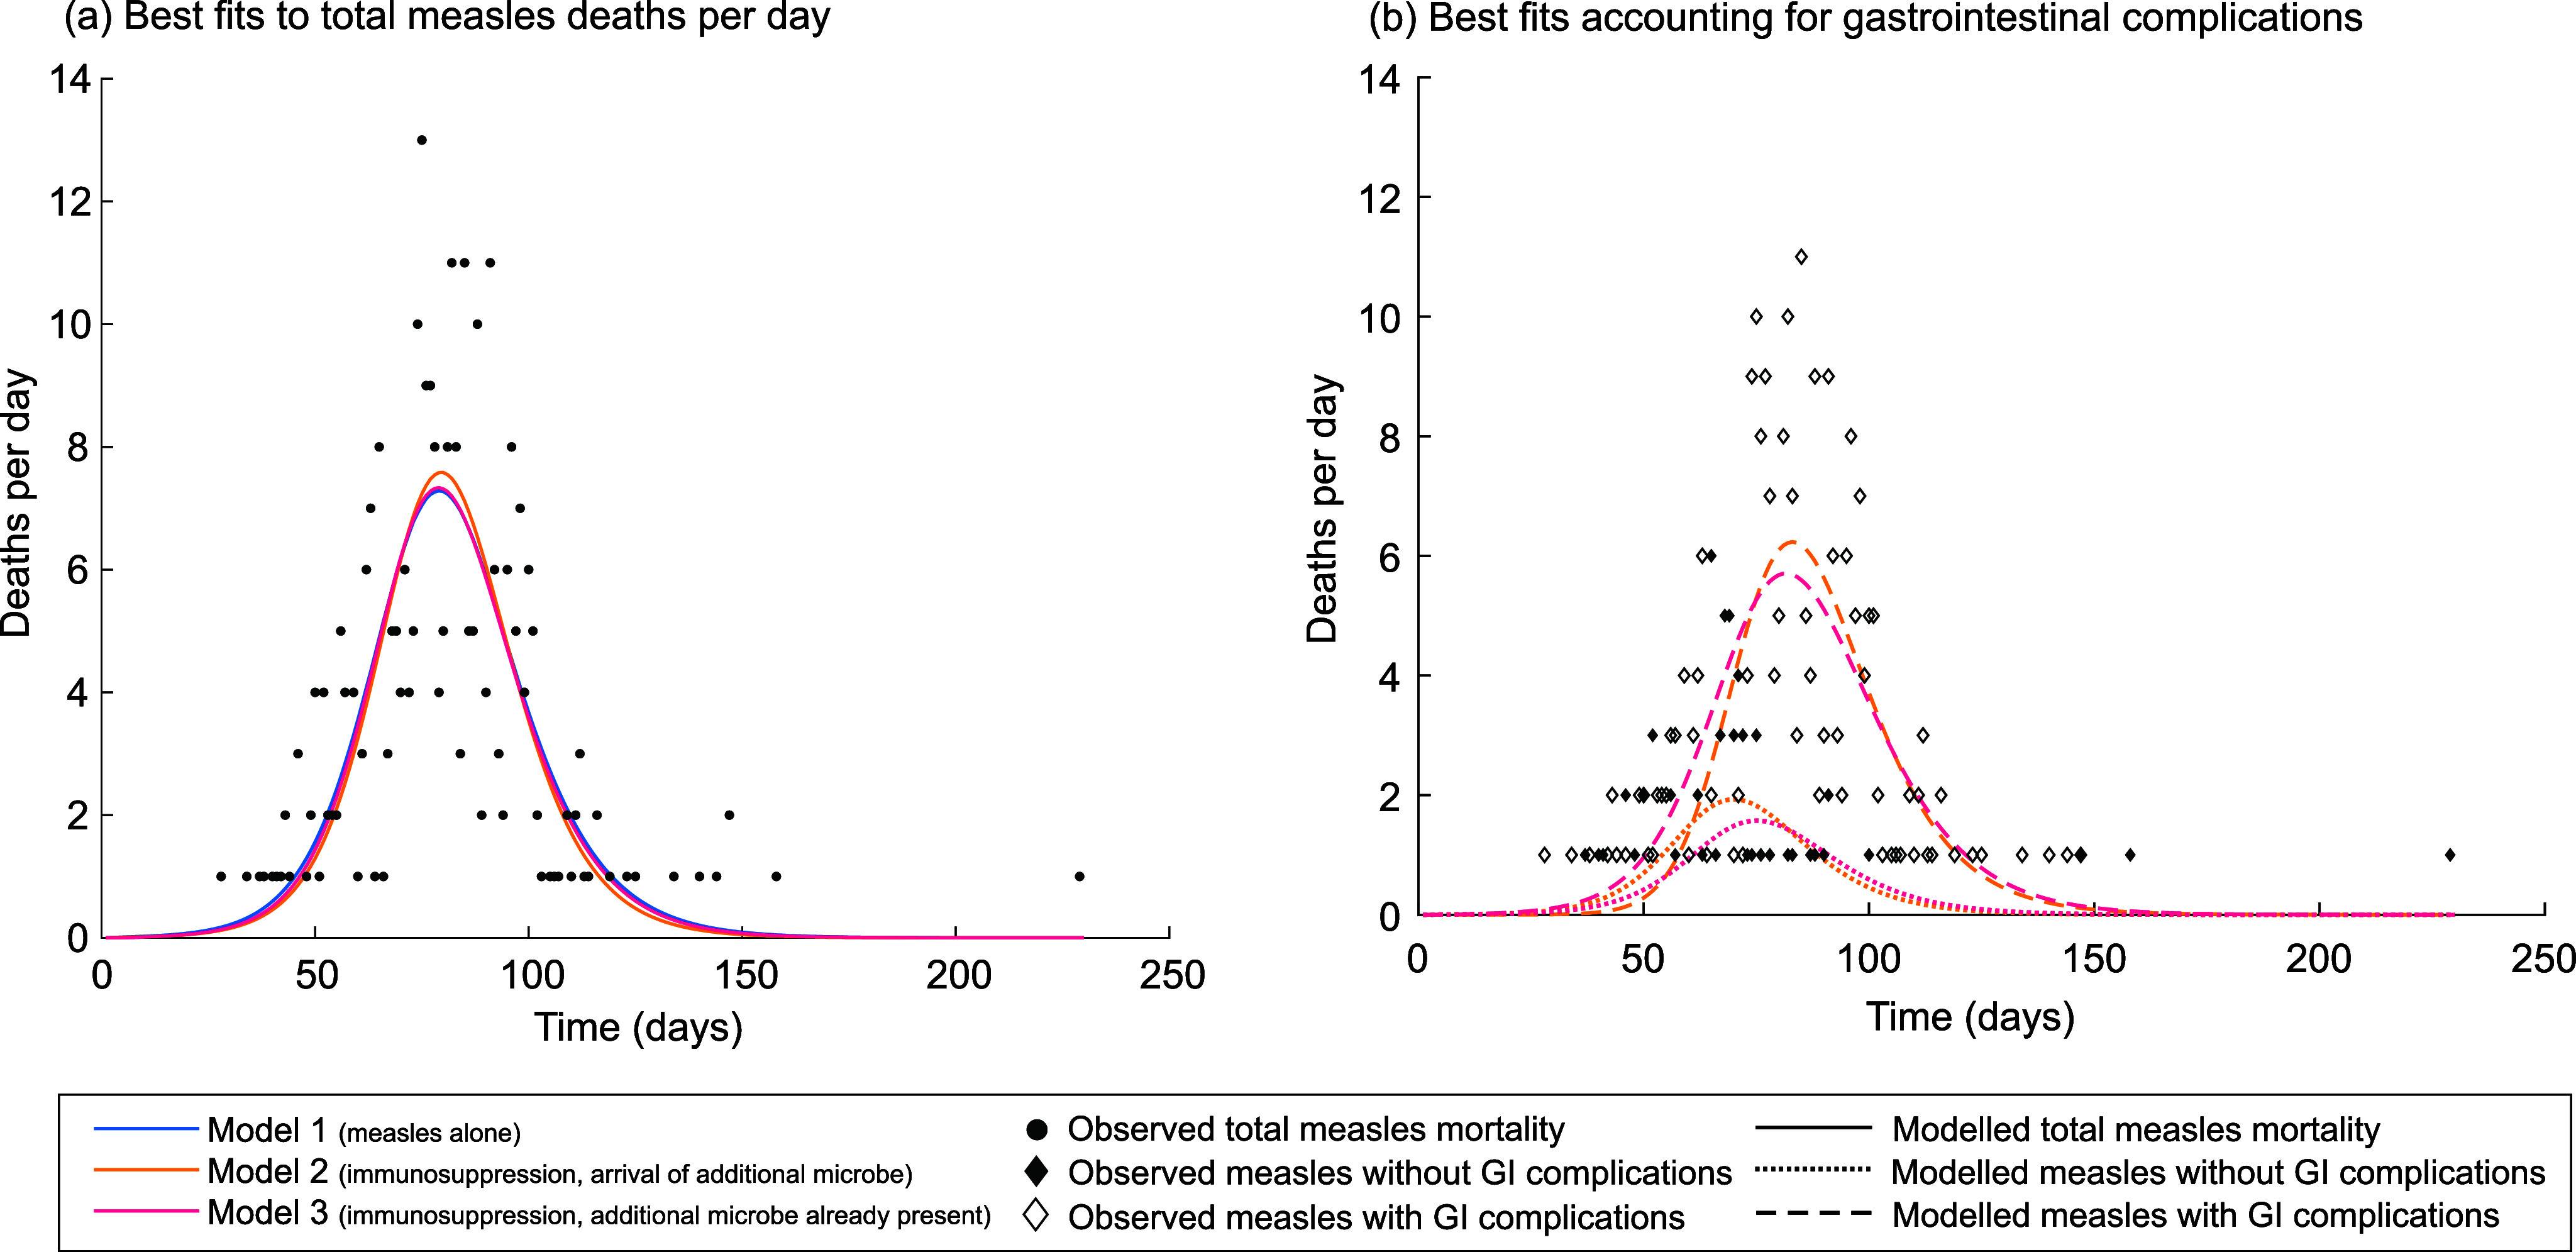
Figure 2.

Least-squares fitting of mortality patterns during the 1911 measles outbreak on Rotuma. Panel (a) illustrates the best-fitting mortality time series generated by each of models 1–3 using least-squares fitting when the models were fitted to the total number of measles deaths per day. Panel (b) illustrates the best-fitting mortality time series for models 2 and 3 using least-squares fitting when the models were fitted to the pattern of measles deaths with and without gastrointestinal complications. In both panels (a) and (b), the two individuals who brought measles to Rotuma were assumed to be in the exposed class. The equivalent results when the two individuals were assumed to be in the infectious class are shown in Supplementary Figure S2.
