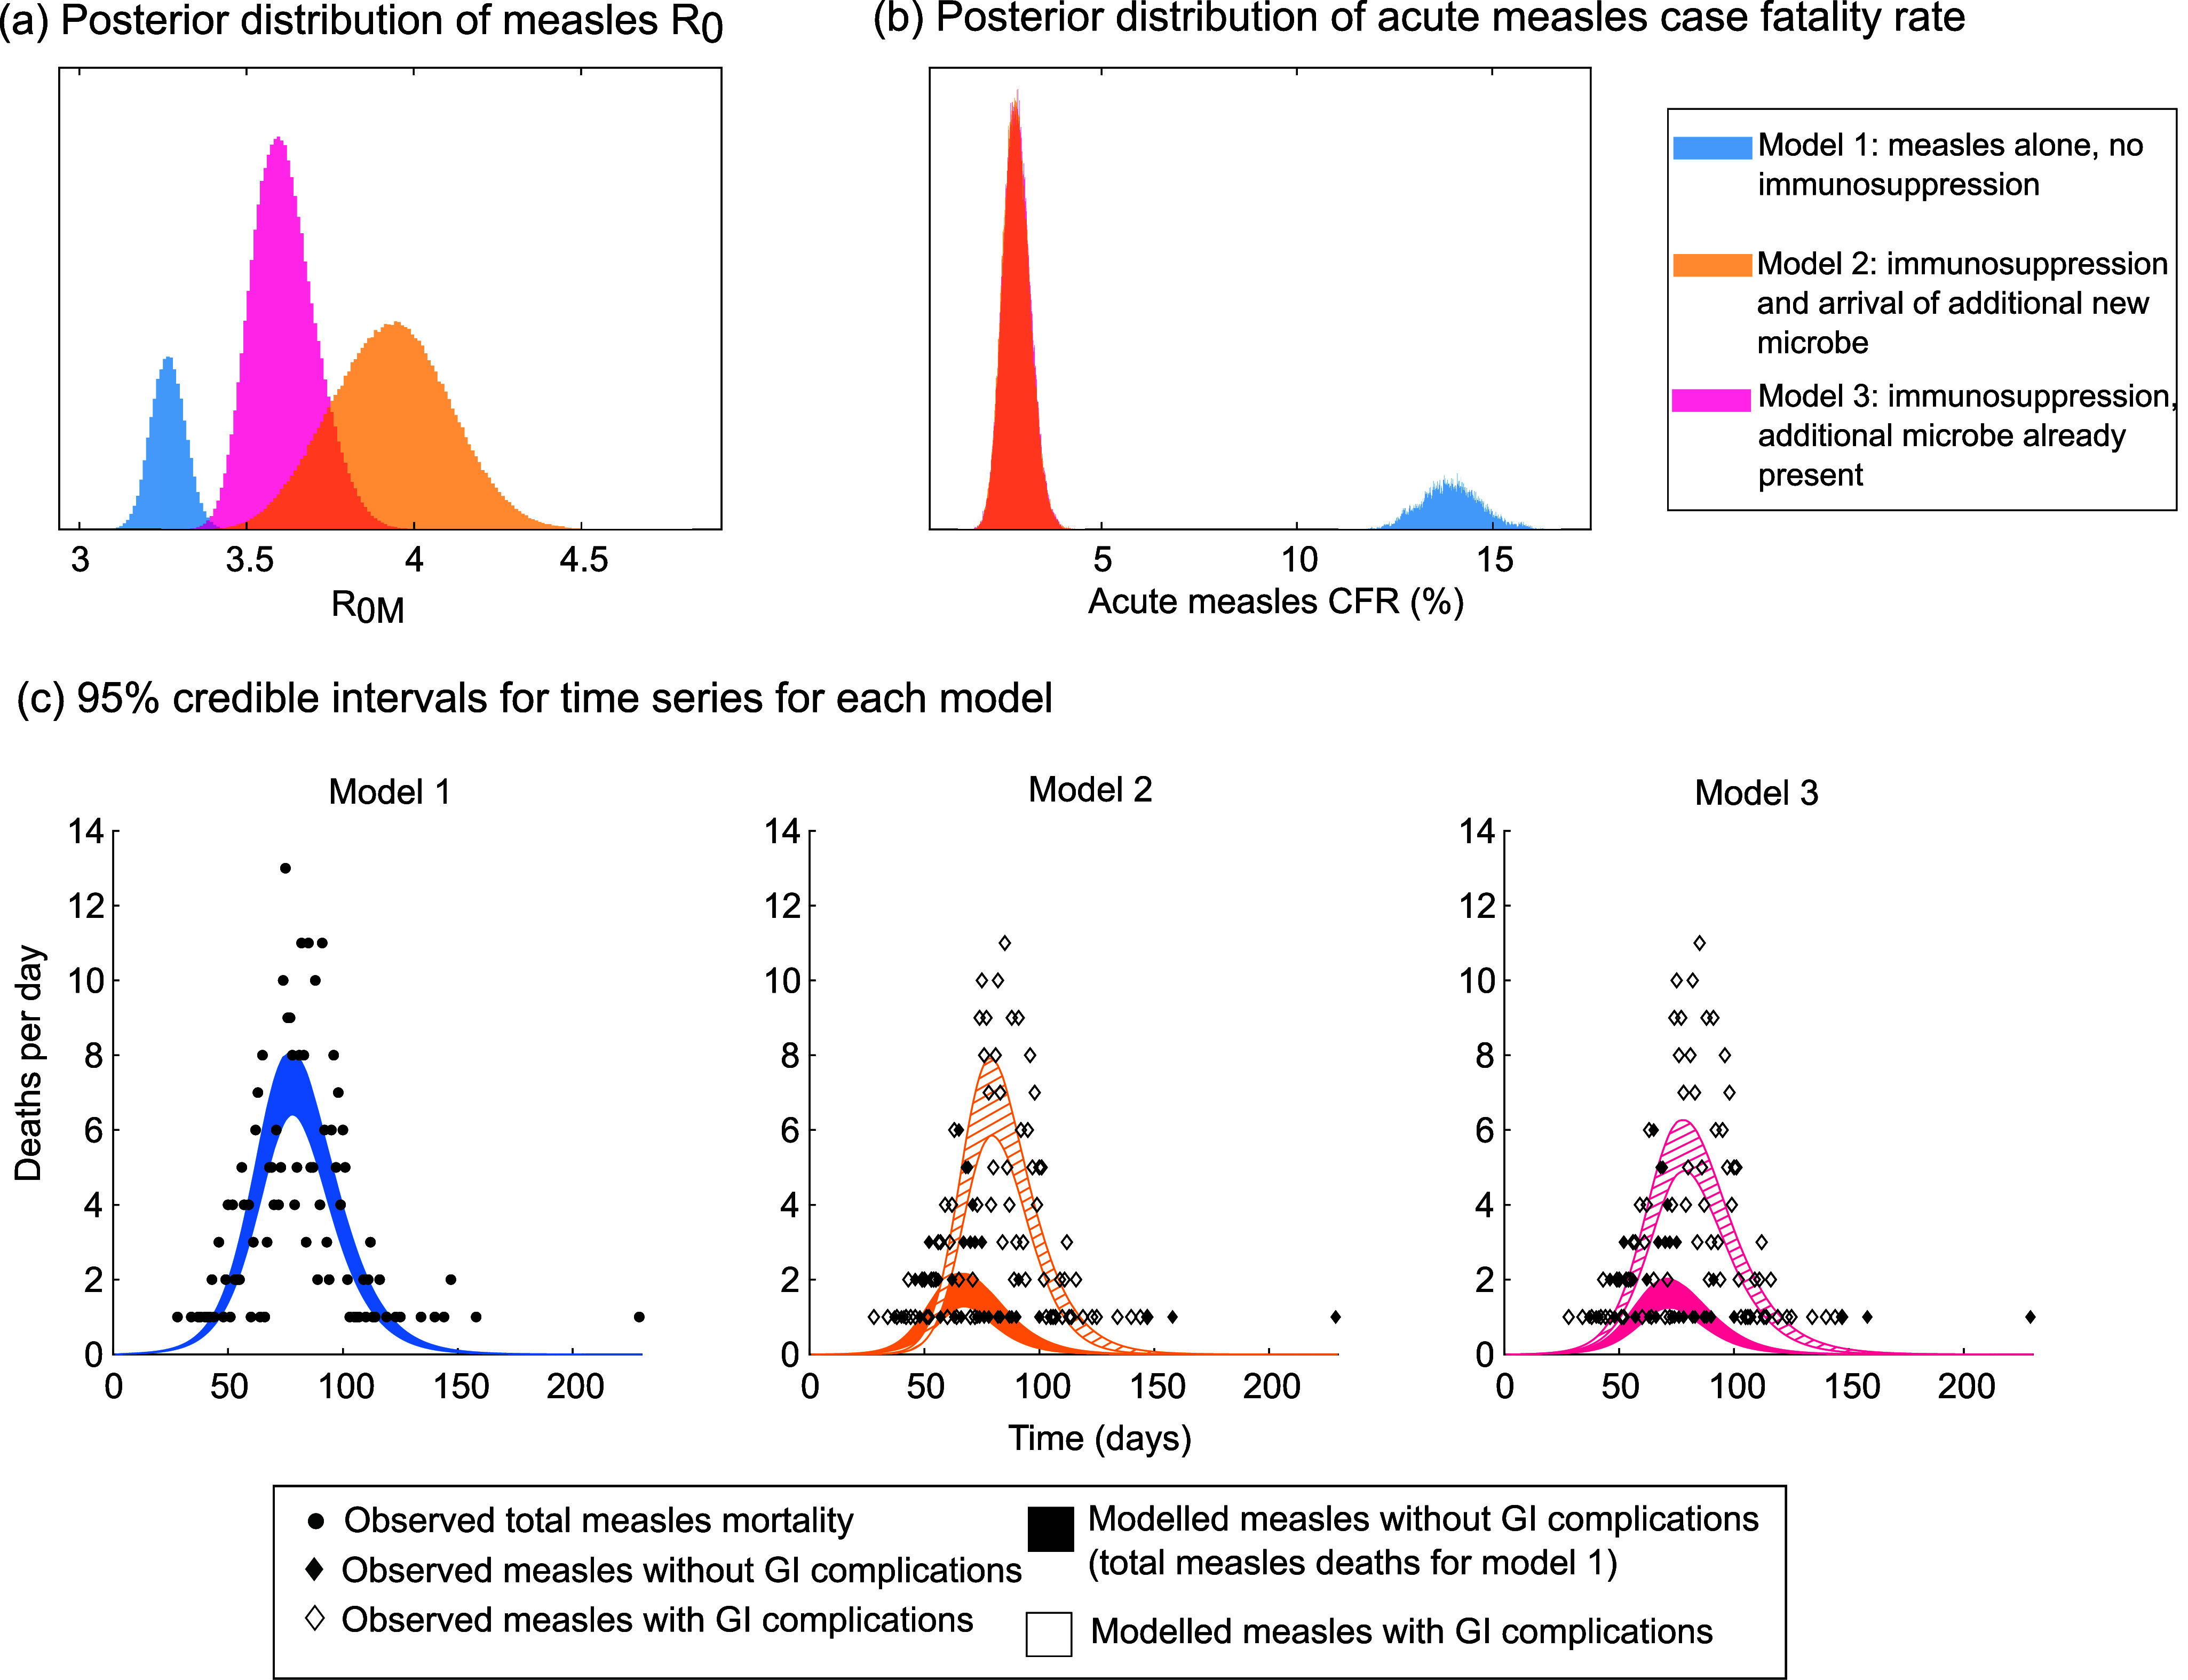
Figure 3.

Estimates of measles R0 and acute measles case fatality rate in models with and without immunosuppression. These results are for the scenario where the two individuals who brought measles to Rotuma were both in the exposed (not yet infectious) class at time = 0. Panels (a) and (b) illustrate posterior distributions for the basic reproduction number of measles (a) and the case fatality rate of acute measles (b), obtained using MCMC as described in the Methods. In panel (b), the estimates for models 2 and 3 are so similar that the distributions overlap. Panel (c) illustrates time series for each of the three scenarios explored: (i) model 1 , in which we do not separate deaths caused by measles alone from deaths associated with both measles and gastrointestinal complications; (ii) the model 2 immunosuppression scenario, in which measles enters the population at the same time as a second novel microbe; and (iii) the model 3 immunosuppression scenario, in which measles disrupts an existing microbial equilibrium on Rotuma. The 95% credible intervals for the model outputs were obtained by sampling 2000 different parameter sets from the joint posterior distribution of all parameters, running the model with each parameter set, recording the range of numbers of deaths per day observed at each time point for all those different parameter values, and then truncating that range by 2.5% from the top and 2.5% from the bottom for each time point.
