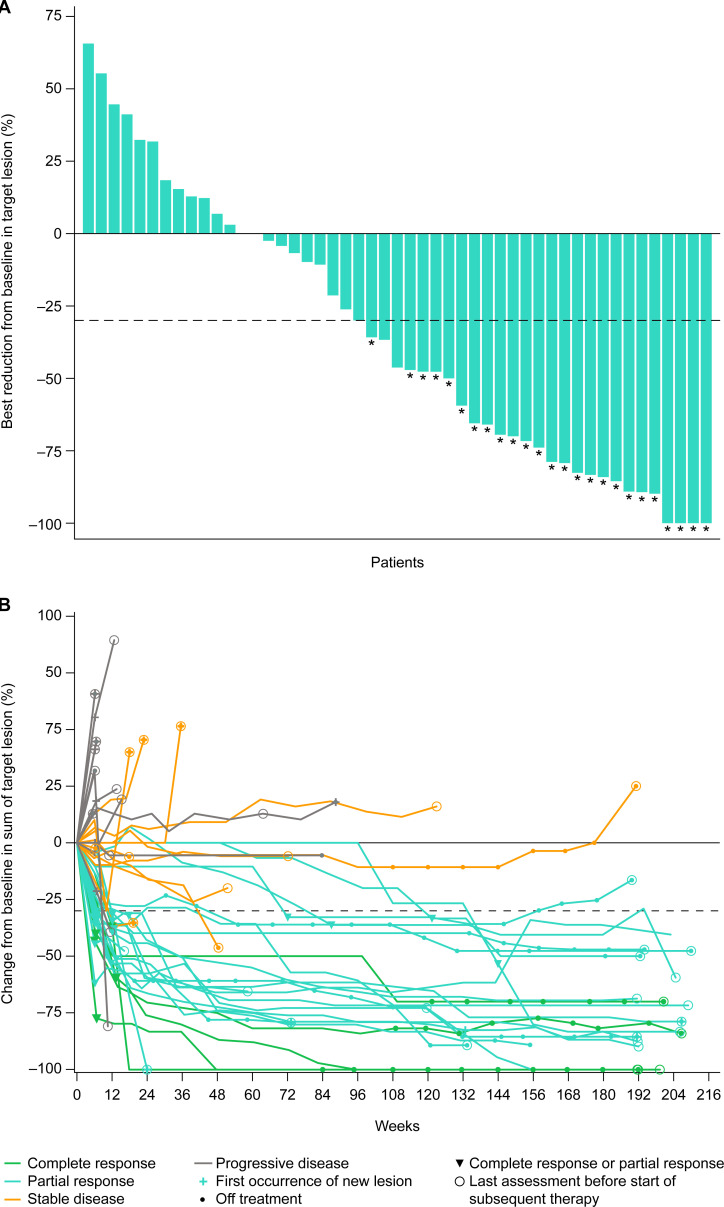
Figure 1.
Antitumor activity. (A) Waterfall plot depicting change from baseline in evaluable patients per investigator. Patients with target lesion at baseline and at least one on-treatment tumor assessment. Best reduction is maximum reduction in sum of diameters of target lesions. Horizontal reference line indicates the 30% reduction consistent with a RECIST V.1.1 response. Asterisk symbol represents responders. (B) Tumor burden change over time per investigator. Patients with target lesion at baseline and at least one postbaseline tumor assessment are included. Assessments are per investigator using RECIST V.1.1, confirmation of response required. Horizontal reference line indicates the 30% reduction consistent with a RECIST V.1.1 response. CR, complete response; dMMR, mismatch repair-deficient; MSI-H, microsatellite instability-high; PD, progressive disease; PR, partial response; RECIST, Response Evaluation Criteria in Solid Tumors; SD, stable disease; UTD, up to date.

