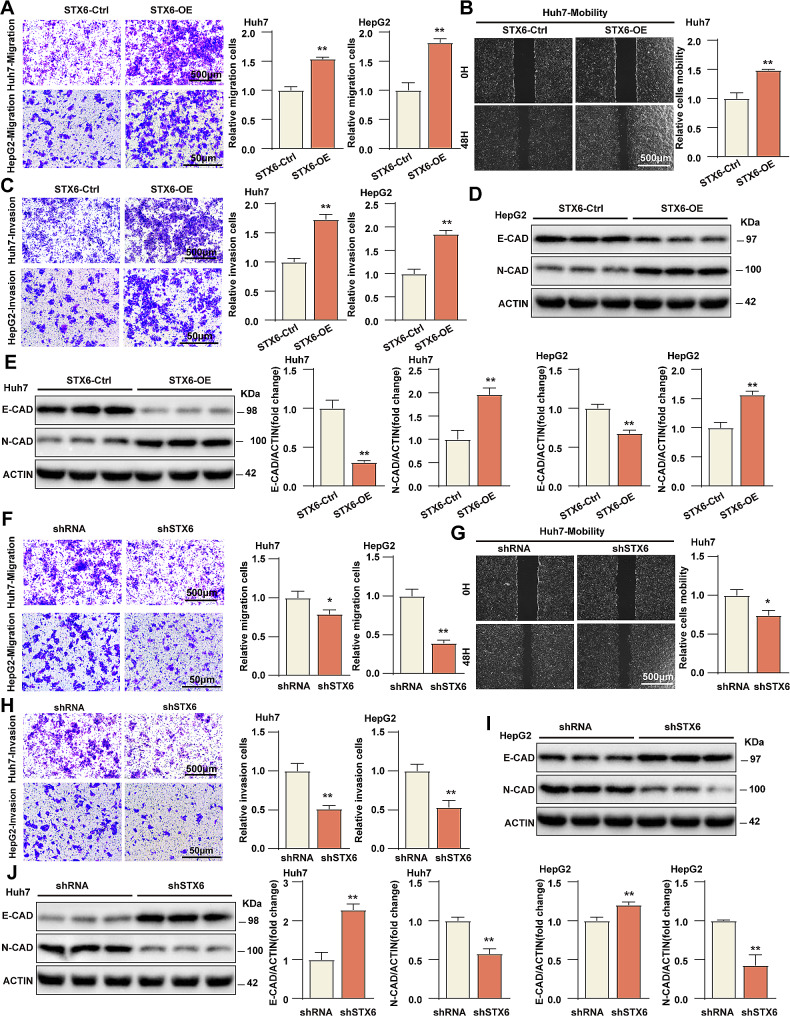
Fig. 3.
STX6 promotes migration and invasion of HCC cells. (A) The representative images and quantification results of Transwell migration assay of Huh7/HepG2 STX6-OE and corresponding control cells. n = 3 per group. (B) The representative images and quantification results of Huh7 STX6-OE and corresponding control cells. n = 3 per group in wound healing assay. (C) The representative images and quantification results of Huh7/HepG2-STX6-OE and corresponding control cells in Transwell invasion assay. n = 3 per group. (D-E) Protein levels and quantification results of metastasis-related E-cadherin and N-cadherin in Huh7/HepG2 STX6-OE and corresponding control cells. n = 3 per group. (F) The representative images and quantification results of Huh7/HepG2 shSTX6 and corresponding control cells in Transwell migration assay. n = 3 per group. (G) The representative images and quantification results of wound healing assay of Huh7 shSTX6 and corresponding control cells. n = 3 per group. (H) The representative images and quantification results of Transwell invasion assay of Huh7/HepG2 shSTX6 and corresponding control cells. n = 3 per group. (I-J) Protein levels and quantification results of metastasis-related E-cadherin and N-cadherin in Huh7/HepG2 shSTX6 and corresponding control cells. n = 3 per group. β-actin served as the loading control. Data was given as mean ± SD. For statistical analysis, the two-tailed Student’s t-test was used in A-C, E-H, and J. * P < 0.05; ** P < 0.01

