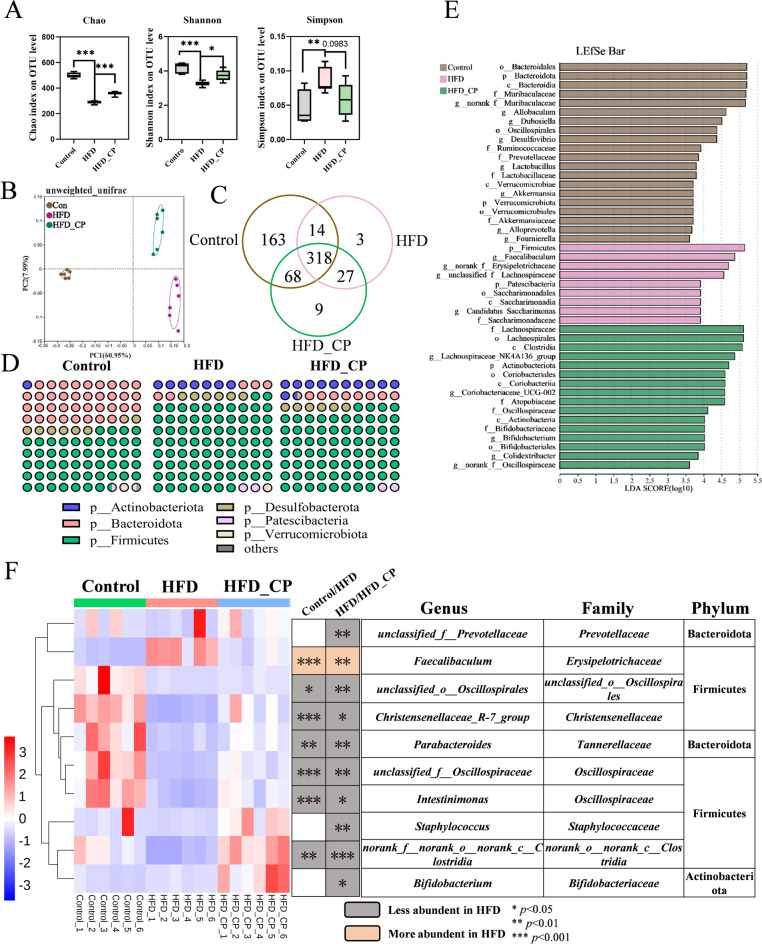
Fig. 2.
CP regulates gut microbiota composition in HFD-fed mice. A Alpha diversity analysis (Chao index, Shannon index and Simpson index) on OUT level. B Beta diversity analysis using the unweighted unifrac method. C Venn plot of the number of OTUs in the control, HFD, and HFD_CP. D Relative abundance of bacteria at phylum level. E Linear discriminant analysis effect size (LEfSe) analysis of the characteristic genera of the gut microbiota. Distribution histogram based on LDA; a higher LDA score represents greater importance of the bacteria. F Heatmap showing the top 10 genera significantly altered by CP in HFD-fed mice. All data are shown as the Mean ± SEM. *p < 0.05, **p < 0.01, ***p < 0.001

