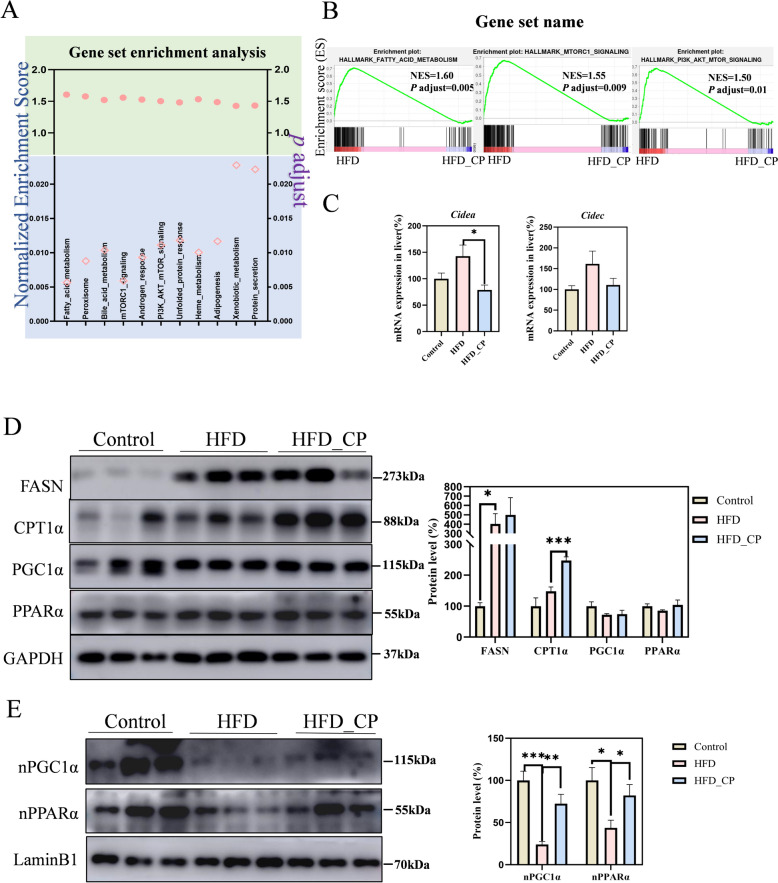
Fig. 6.
CP improves HFD-induced NAFLD by activating PPARα. A The reversed pathways by CP, which was enriched with gene set enrichment analysis (GSEA) (adjusted p < 0.05). B The fatty acid metabolism, mTORC1 signaling, and PI3K-AKT-mTOR signaling pathways which are from the GSEA analysis of the liver gene profiling. Mice were treated as in Fig. 1. C mRNA expression of Cidea and Cidec in the liver. D The expression of total proteins of FASN, PPARα, PGC1α and CPT1α in the liver. E The protein level of nuclear PPARα and nuclear PGC1α in the liver. All data are shown as the Mean ± SEM. *p < 0.05, **p < 0.01, ***p < 0.001

