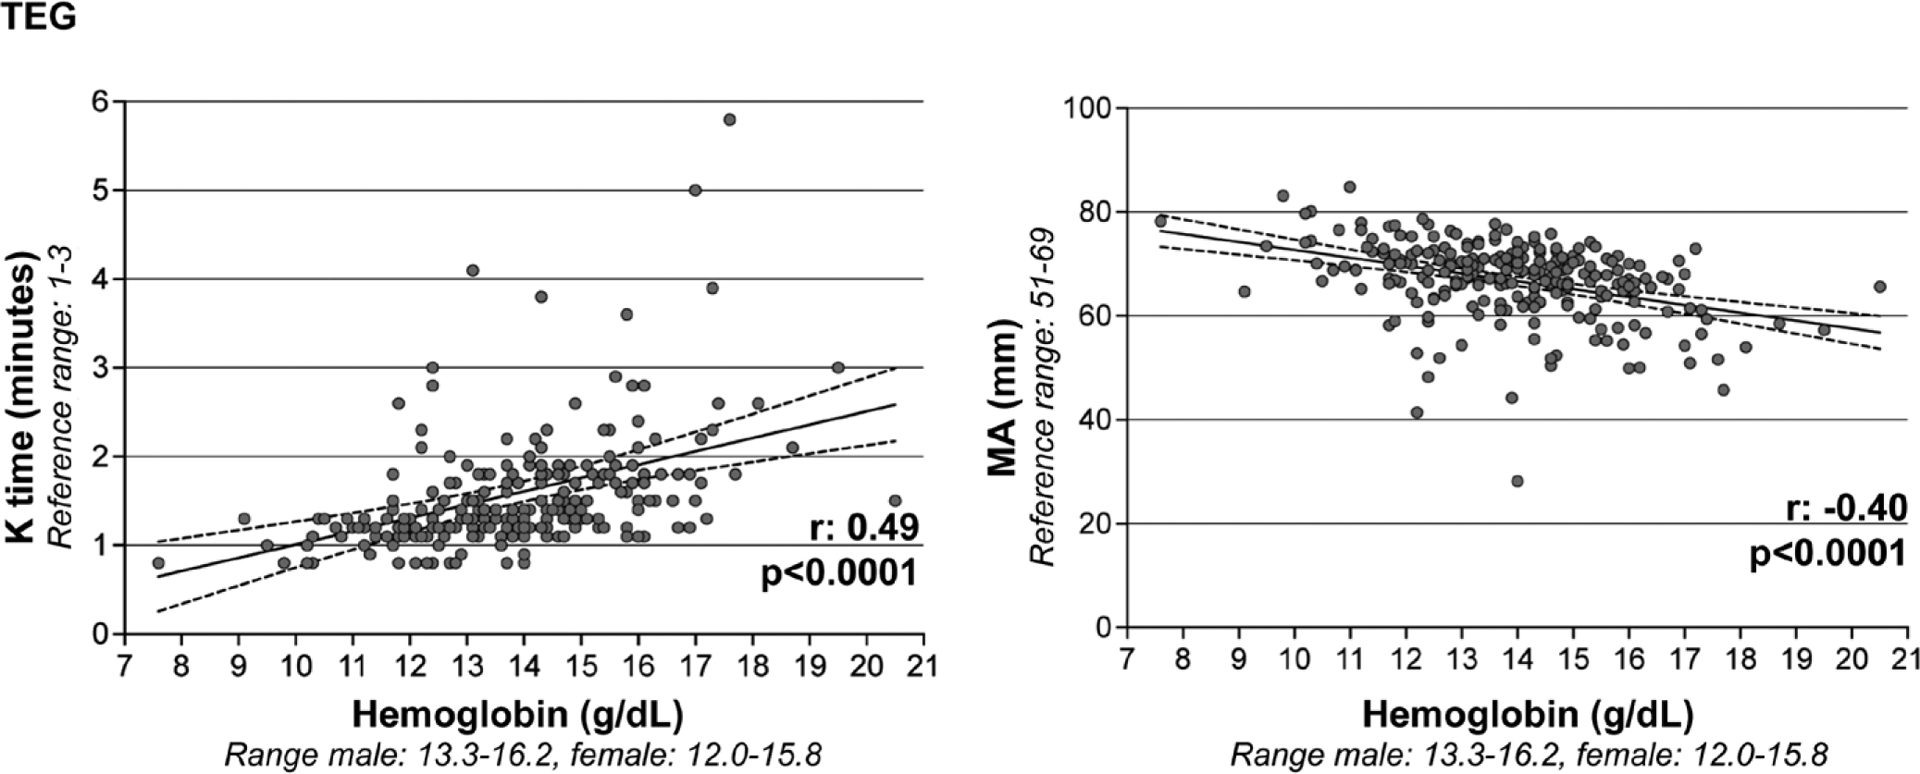
Figure 3.

Correlations of baseline hemoglobin with thromboelastography (TEG). Hemoglobin (x axis) is directly correlated with coagulation kinetics (TEG kinetics time [K time], depicted on y axis) and inversely correlated with coagulation strength (TEG maximum amplitude [MA], depicted on y axis).
