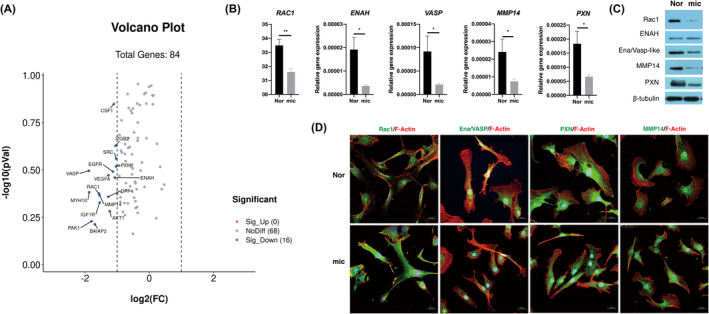
FIGURE 2.

The expression of motility‐related genes decreased with aberrant localization in microtia chondrocytes. (A) Volcano plot of differentially expressed motility‐related genes in Nor (n = 3) and mic (n = 3) (Log2(FC) < −1). (B) The mRNA expression of RAC1, ENAH, VASP, MMP14 and PXN between Nor (n = 13) and mic (n = 12). Relative gene expression was normalized to GAPDH. (C) The protein level of Rac1, ENAH, Ena/VASP‐like, MMP14 and PXN in normal and microtia chondrocytes. (D) Representative immunofluorescence staining of five candidate proteins in normal and microtia chondrocytes. Experiment was repeated three times independently. Scale bars, 20 μm. Nor indicates normal chondrocytes, mic indicates microtia chondrocytes. Data were analysed using two‐tailed Student's t test. Values are presented as the mean ± SEM. *Indicates p < 0.05 and **indicates p < 0.01.
