
FIGURE 3.
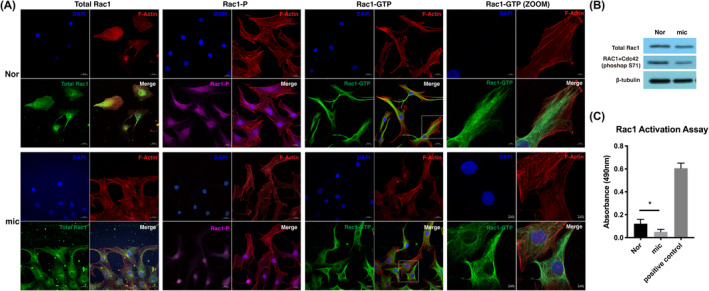
Rac1 showed abnormal conformational states in microtia chondrocytes. (A) Representative immunofluorescence imaging of different states of Rac1 in migratory chondrocytes based on wound healing assay. Scale bars, 20 μm, 5 μm. (B) The protein expression level of total Rac1 and phosphorylated Rac1 (S71) in microtia chondrocytes and normal chondrocytes. (C) The active Rac1 level of normal chondrocytes (n = 3) and microtia chondrocytes (n = 3). The relative content of active Rac1 was normalized by comparison with total protein, and the results were corrected with the positive control by the standard protein attached to the kit (n = 3). Nor indicates normal chondrocytes, mic indicates microtia chondrocytes. Data were analysed using two‐tailed Student's t test. Values are presented as the mean ± SEM. *Indicates p < 0.05.