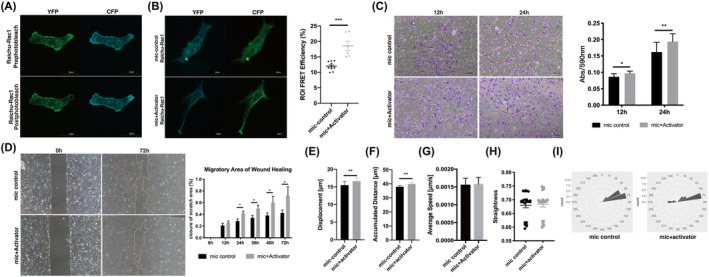
FIGURE 4.

Active Rac1 was critical for directional persistence of microtia chondrocyte migration. (A) Spatiotemporal maps of active Rac1 dynamics were imaged with a FRET‐based Rac1 biosensor in microtia chondrocytes. The white circle indicates photobleached area (ROI). Scale bars, 20 μm. (B) The FRET efficiency of microtia chondrocytes after 5 min of stimulation. Scale bars, 20 μm. (C) Transwell assay and statistical analysis of microtia chondrocytes (n = 4) with stimulation. (D) The wound healing assay and migratory area statistics of microtia chondrocytes (n = 3) and the corresponding stimulation group. (E–I) Trajectories and analysis of spontaneous cell migration of microtia chondrocytes and the corresponding stimulation group (n = 4). Mic indicates microtia chondrocytes. Data were analysed using two‐tailed Student's t test. Values are presented as the mean ± SEM. *Indicates p < 0.05, **indicates p < 0.01, and ***indicates p < 0.001.
