
Figure 7.
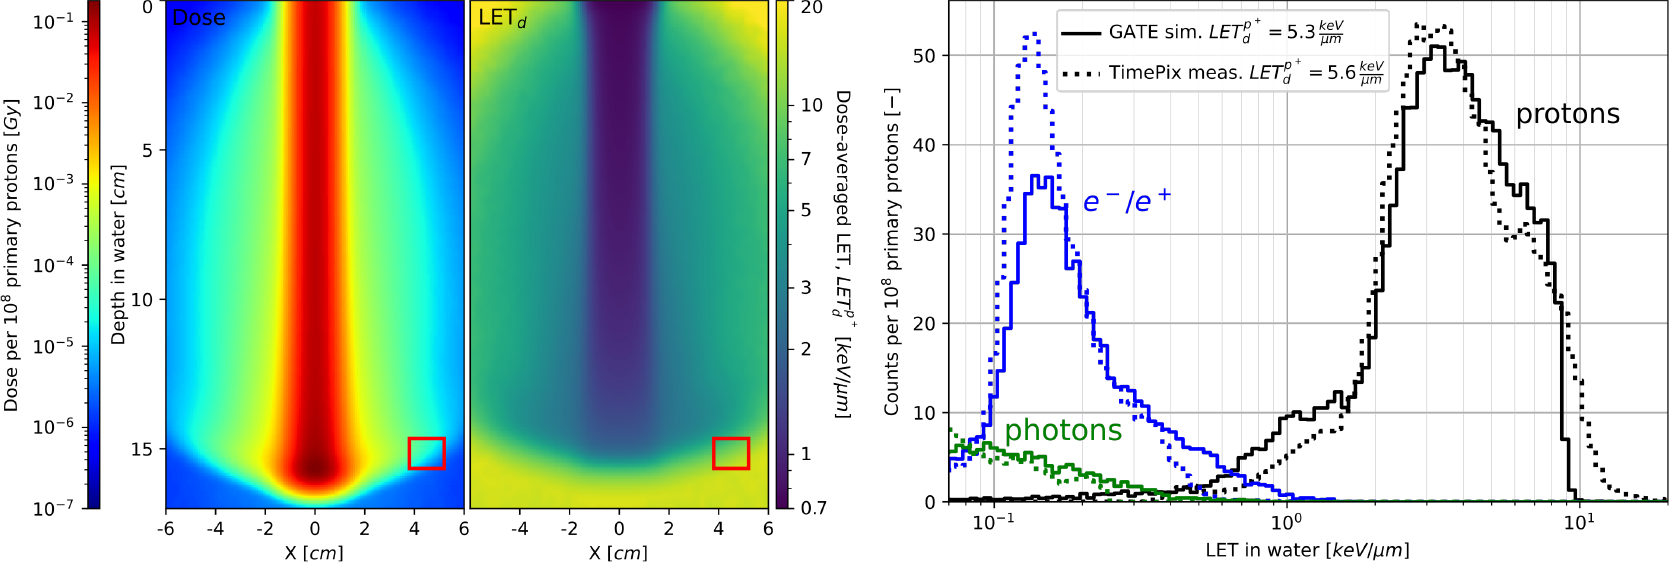
2D dose (left panel) and LETd of protons (middle panel) distributions in water for therapeutic pencil proton beam at 150 MeV and the corresponding LET spectrum (right panel) for the measurement point at the Bragg peak depth, 45 mm from the beam axis, indicated with red squares on left and middle panels. Proton, electron and photon contributions to the LET spectrum are calculated with GATE and compared to the measurement with a TimePix detector. Wide range of proton LET values is approximated by the averaged LETd given in the legend.