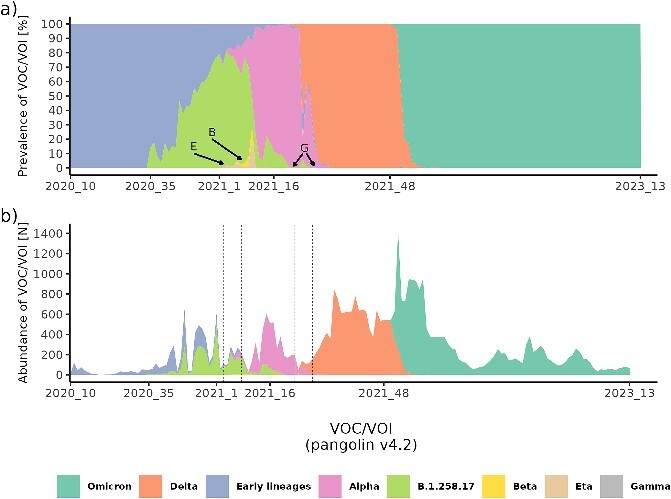
Figure 2.

Temporal lineage distribution from the beginning of March 2020 to the end of March 2023 (161 weeks) as determined by CGS. The annotation of week on the x-axis corresponds to the points of transition from the predominance of the previous to the next VOC/VOI and the delineation of the entire timeframe of CGS surveillance of SARS-CoV-2 variants. Panel (A) shows the temporal relative prevalence of major VOCs/VOIs, and panel (B) shows the absolute abundance of the major VOCs/VOIs. In panel (A) rare variants Eta (E), Beta (B), and Gamma (G) are highlighted due to low prevalence. The corresponding temporal positions of these variants in panel (B) are denoted by dashed lines.
