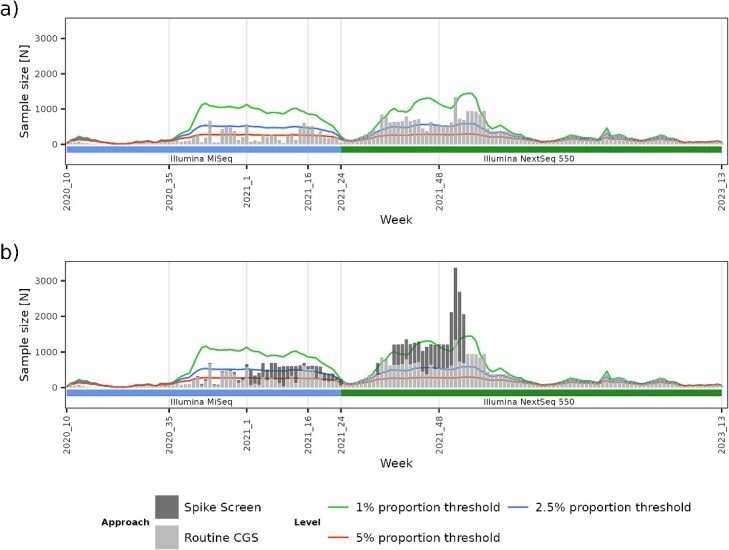
Figure 3.

Overview of the increase in SARS-CoV-2 sequencing volume by adding a higher throughput instrument and the contribution of the Spike Screen strategy to the overall CGS samples monitored for VOCs/VOIs. Panel (A) shows the sequencing volume attained with routine CGS per week. Coloured lines represent sample size threshold requirements to secure circulating variant detection at 1, 2.5, and 5% prevalence. Panel (B) shows the contribution of the Spike Screen capacity expansion compared with the baseline CGS.
