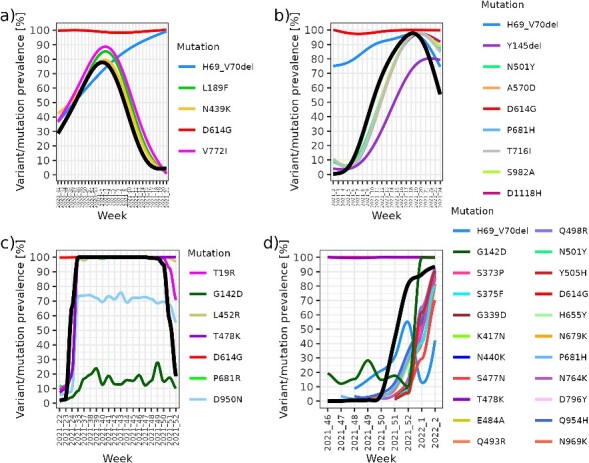
Figure 5.

Relationships between monitored mutations and population prevalence of (A) B.1.258.17, (B) Alpha, (C) Delta, and (D) Omicron. The coloured lines represent the monitored prevalence of the characteristic mutations (obtained with the Spike Screen strategy), and the bolded black line represents the prevalence in the population (obtained with routine CGS monitoring). Early signal from Spike Screen characteristic mutation monitoring can be observed, prior to CGS confirmed occurrence of lineage as above-threshold (5%) frequency of observed mutations (panels B, C, and D).
