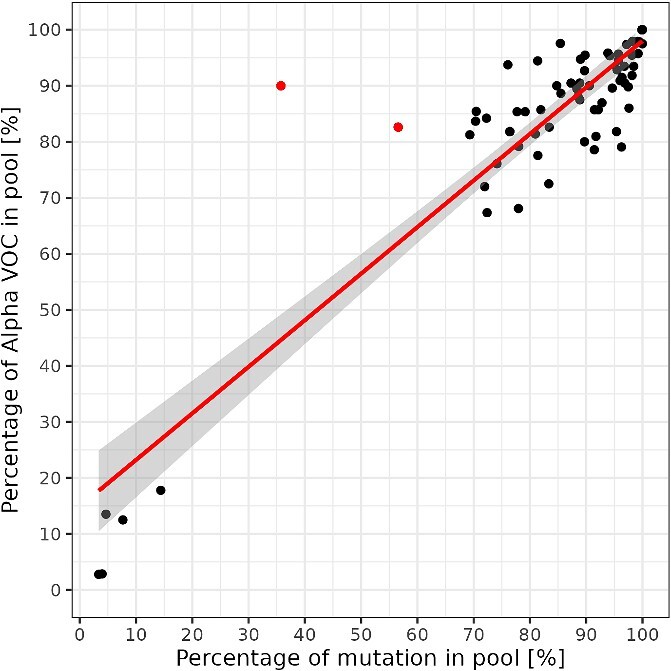
Figure 7.

Relationship between characteristic mutation frequency and the known percentage of Alpha in a pool. The red regression line indicates the significant linear relationship between the characteristic Alpha mutation S:P681H frequency and actual Alpha prevalence. Two red dots in the upper middle part represent the outliers based on Cook’s distance. The deviation from the regression line in these two pools was due to samples with high variability of Ct values in these pools.
