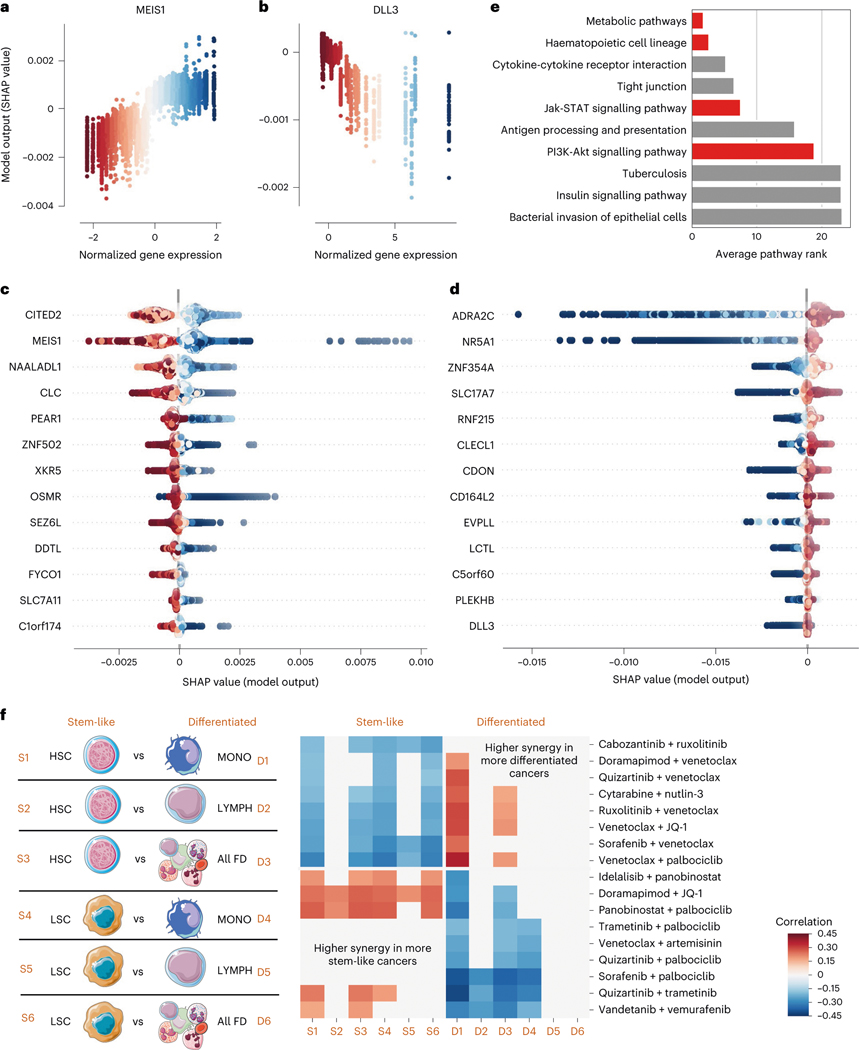
Fig. 5 |. Transcriptomic factors affecting anti-AML drug combination synergy.
a,b, SHAP dependency plots for MEIS1 and DLL3. Each point represents a single sample (one patient with a pair of anticancer drugs), the axis and colour coding represent the normalized gene expression values, and the axis represents the feature attribution value (change in predicted drug synergy attributable to that feature). c,d, SHAP summary plots for the transcripts with the strongest positive (c) and negative (d) relationships with anti-AML drug synergy. Each point still represents a single sample and the colour coding still represents normalized gene expression values, but the axis now represents the feature attribution value (plotted on the axis in the corresponding analysis in a and b). e, Biological pathways most highly enriched in the list of most important gene expression features, sorted by their average ranking across several top gene thresholds. Red bars indicate pathways discussed further in the text. f, For 12 separate differential gene expression profiles created by pairing gene expression measurements from a more stem-like haematopoietic lineage cell population (HSCs or LSCs) with a more differentiated haematopoietic lineage cell population (monocytes, lymphocytes, or all fully differentiated cells), we measured the correlation between the average expression of that profile and the synergy for each drug combination. After FDR correction, we plotted all combinations with significant correlations across at least two profiles. We find that some combinations of drugs tend to have higher synergy in more differentiated cancers, and that some combinations of drugs tend to have higher synergy in more stem-like cancers.

